Technical analysis built from every trade.
Most charts show you the price. SEPT’s chart also shows the trades behind it, and works it all out for you.
SEPT Investing is technical-analysis software built on real price action. It builds bars from every US stock trade and works out the facts traders read on a chart (real buying vs. selling, swing structure, key levels with their full touch-and-break history, zones, chart patterns and trendlines), then lets you scan, alert, backtest and automate on those same facts.
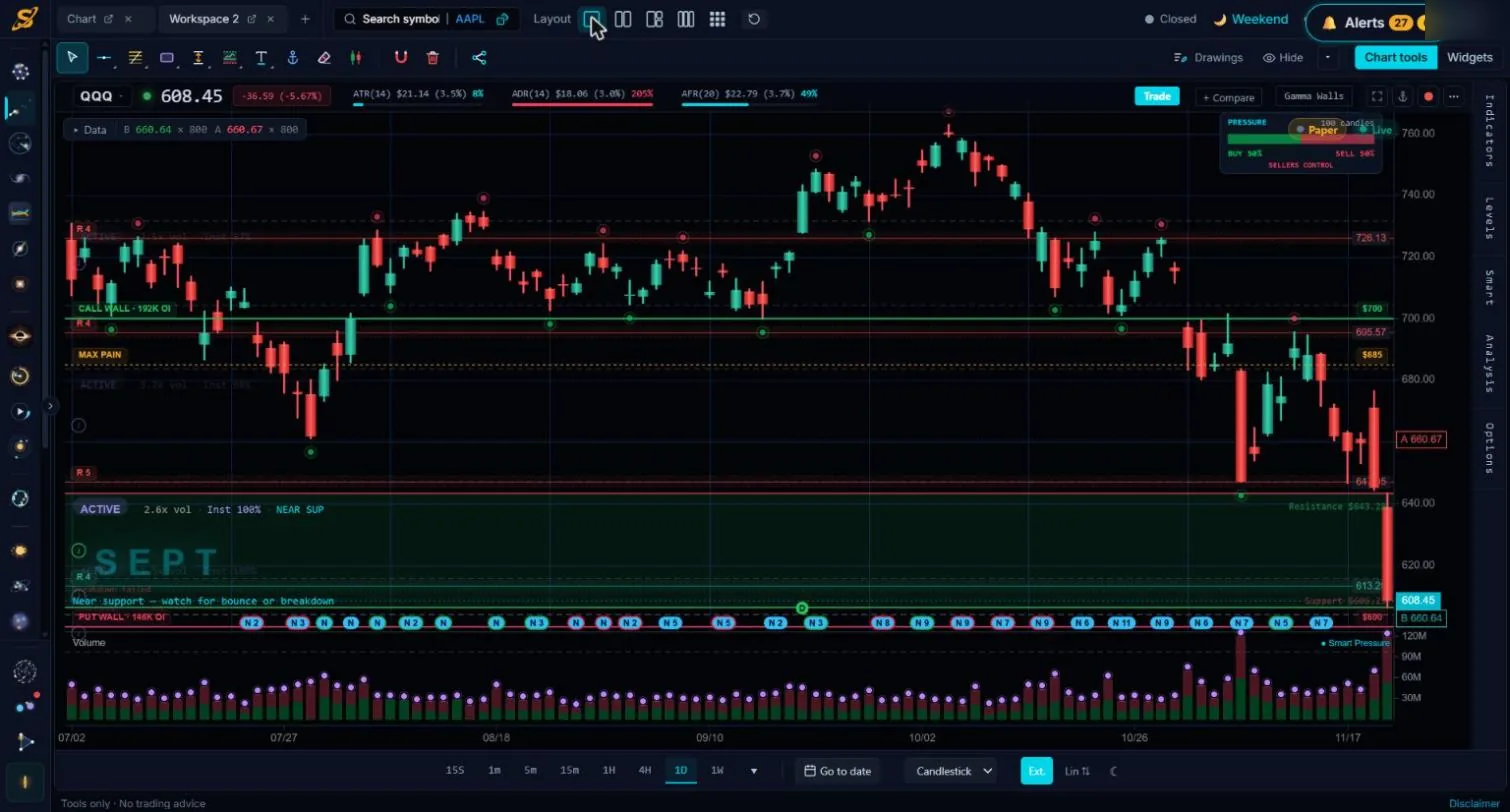
What SEPT computes from price action
All of this is on the SEPT chart the moment it opens, for every US stock and ETF.
Pressure
Swing structure
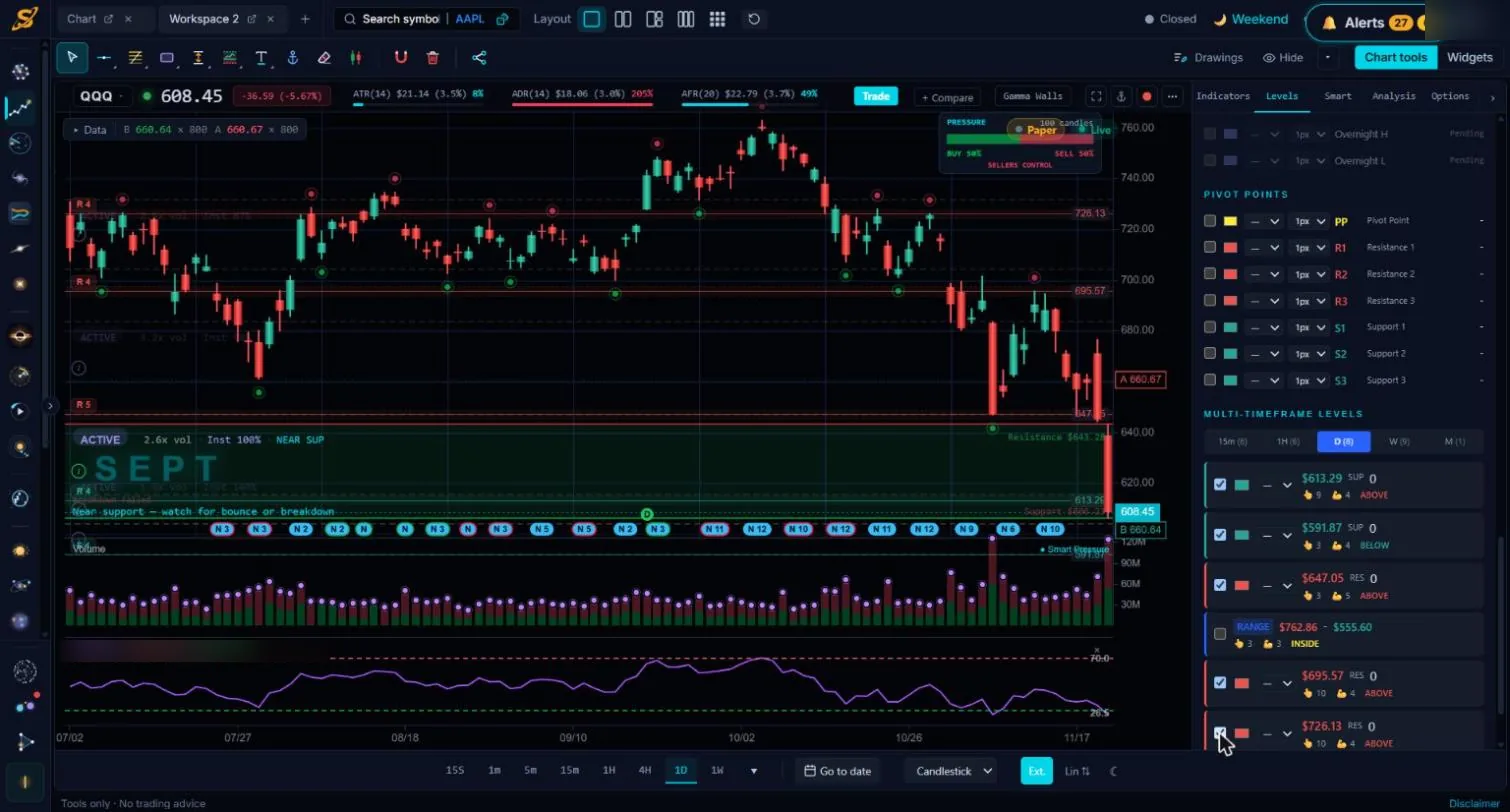
Key levels with history
Zones
Volume vs. normal
Chart pattern detection
Auto trendlines
Volume profile
Multi-timeframe views
Bars down to 15 seconds
Custom indicators, no code
Use it, not just look at it
The same facts drive the Screener (400+ fields), Alerts, the Playbook, Backtesting on 1-minute data back to 2003, Replay, Paper Trading and Full Autonomous Trading. A level, a swing or a pattern you see on the chart is the same one your screener scans, your alert watches and your backtest tests.
Odds tables show how price behaved in the same situation in the past, down to 1-minute bars, so you know a setup’s odds before you trade it.
Where GOAX fits
GOAX is SEPT’s AI assistant. It reads these same computed facts (levels, swings, real buying vs. selling, zones) and explains them in plain words, with the real numbers.
What to look for in technical-analysis software
| Question to ask | SEPT |
|---|---|
| Are levels shown with their history (touches, holds, breaks)? | ✓ |
| Is buying vs. selling measured from real trades, not candle colour? | ✓ |
| Can you backtest a screener (different stocks each day) on 1-minute data? | ✓ |
| Can the same rules run as alerts and as automation? | ✓ |
Ask these questions of any technical-analysis tool, including ours.
See how four platforms answer them: best technical analysis software for stock traders (2026).
Technical analysis questions
Does SEPT have automated trendlines and pattern detection?
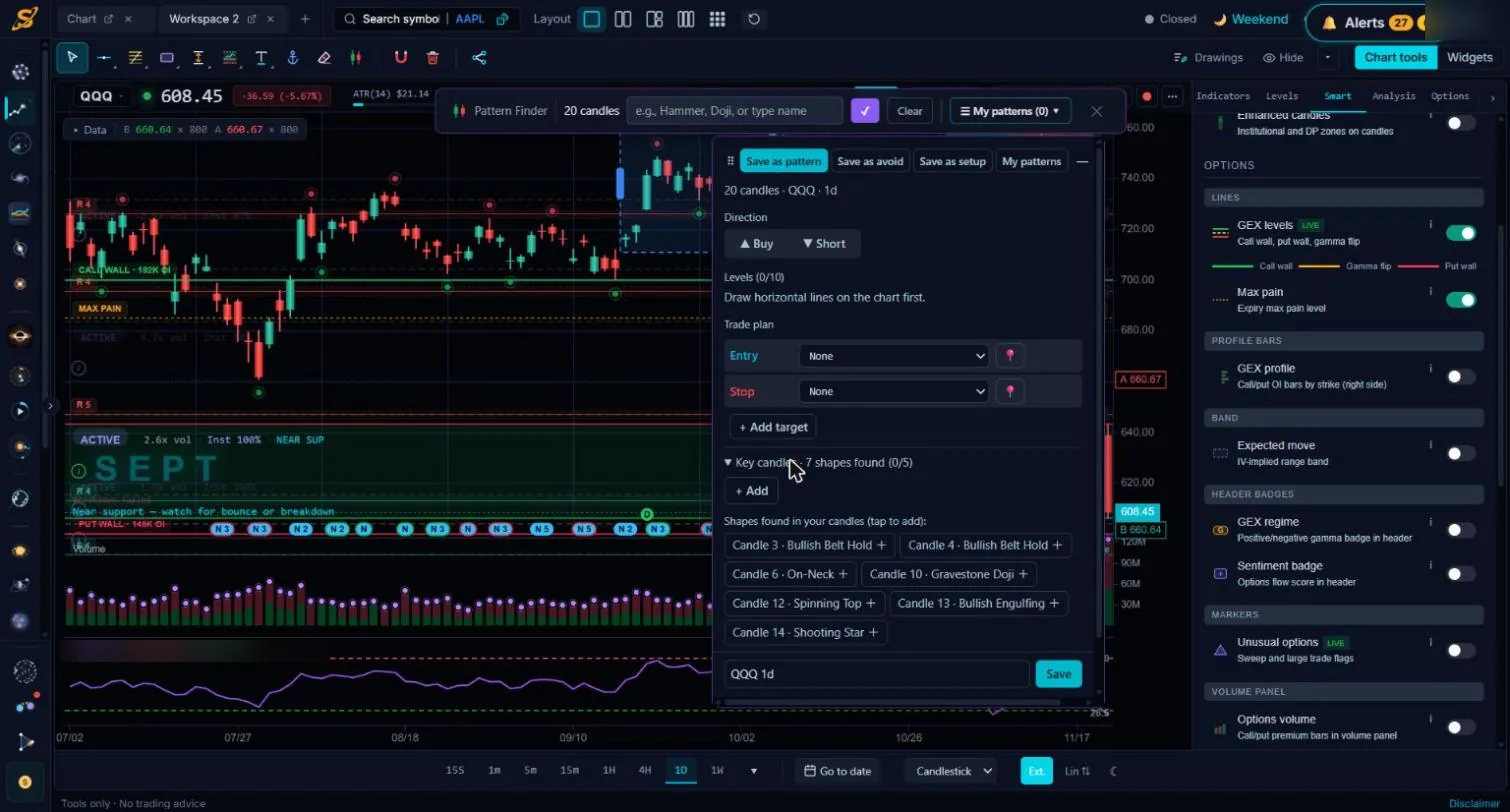
Yes. Trendlines are drawn automatically from SEPT’s swing points. Pattern Finder finds candlestick shapes in any candles you select and looks for chart patterns such as flags and head & shoulders. Auto anchored VWAP, Fibonacci retracement and volume profile are drawn too.
Is SEPT a charting platform?
SEPT includes a full chart with 77 built-in indicators, drawings and multi-chart workspaces, but it is more than a chart: the same price-action facts drive its screener, alerts, backtesting, paper trading and Full Autonomous Trading.
How is SEPT’s technical analysis different from a standard indicator chart?
A standard chart gives you candles and formulas to apply yourself. SEPT works the facts out first from every trade: real buying vs. selling, confirmed swings, levels with their touch-and-hold history and zones, and you can scan, alert, backtest and automate on them.
What does GOAX do?
GOAX reads the facts SEPT computes from every trade and explains them in plain words. The analysis underneath comes from SEPT’s price-action data, so GOAX’s answers use real levels and real buying vs. selling, not guesses.
See it on your own symbols
Start freeQuestions? Contact us.
Data and education only, no investment advice. SEPT provides tools only; all setups and trades are yours.