A stock chart that draws the levels, zones and patterns for you.
Most charts show you the price. SEPT’s chart also shows the trades behind it, and works it all out for you.
SEPT Investing’s chart is technical-analysis software built on real price action. The moment it opens, it draws key levels with their touch-and-hold history, zones, swing structure with trendlines, volume profile and real buying vs. selling, worked out from every US stock trade. Any pattern you find on it can become a setup you screen, backtest and automate.
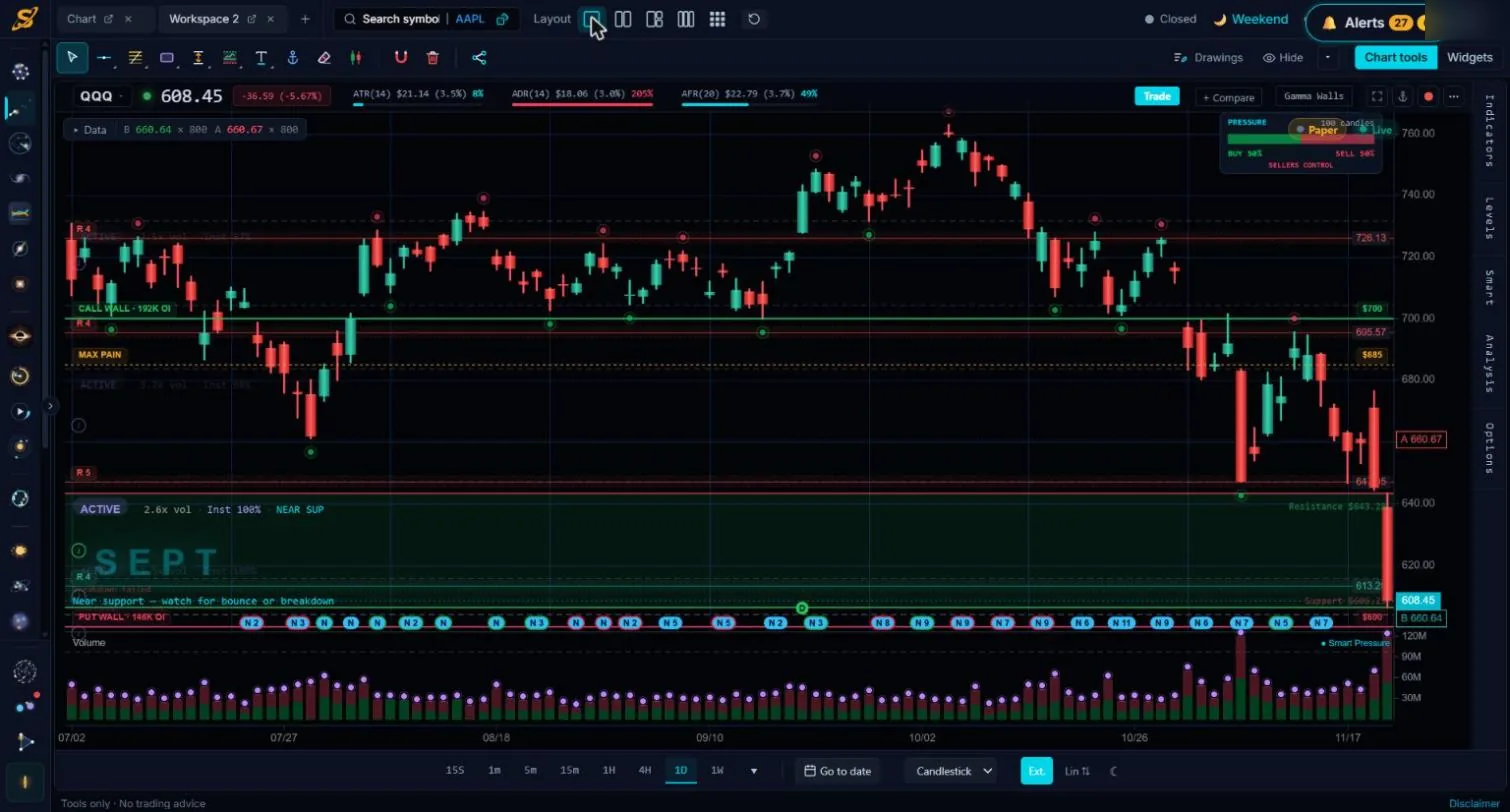
Drawn the moment the chart opens
No setup, no indicators to add. These are on the chart as soon as you open a symbol.
Range header
Real buying vs. selling
Zones
Events and quotes
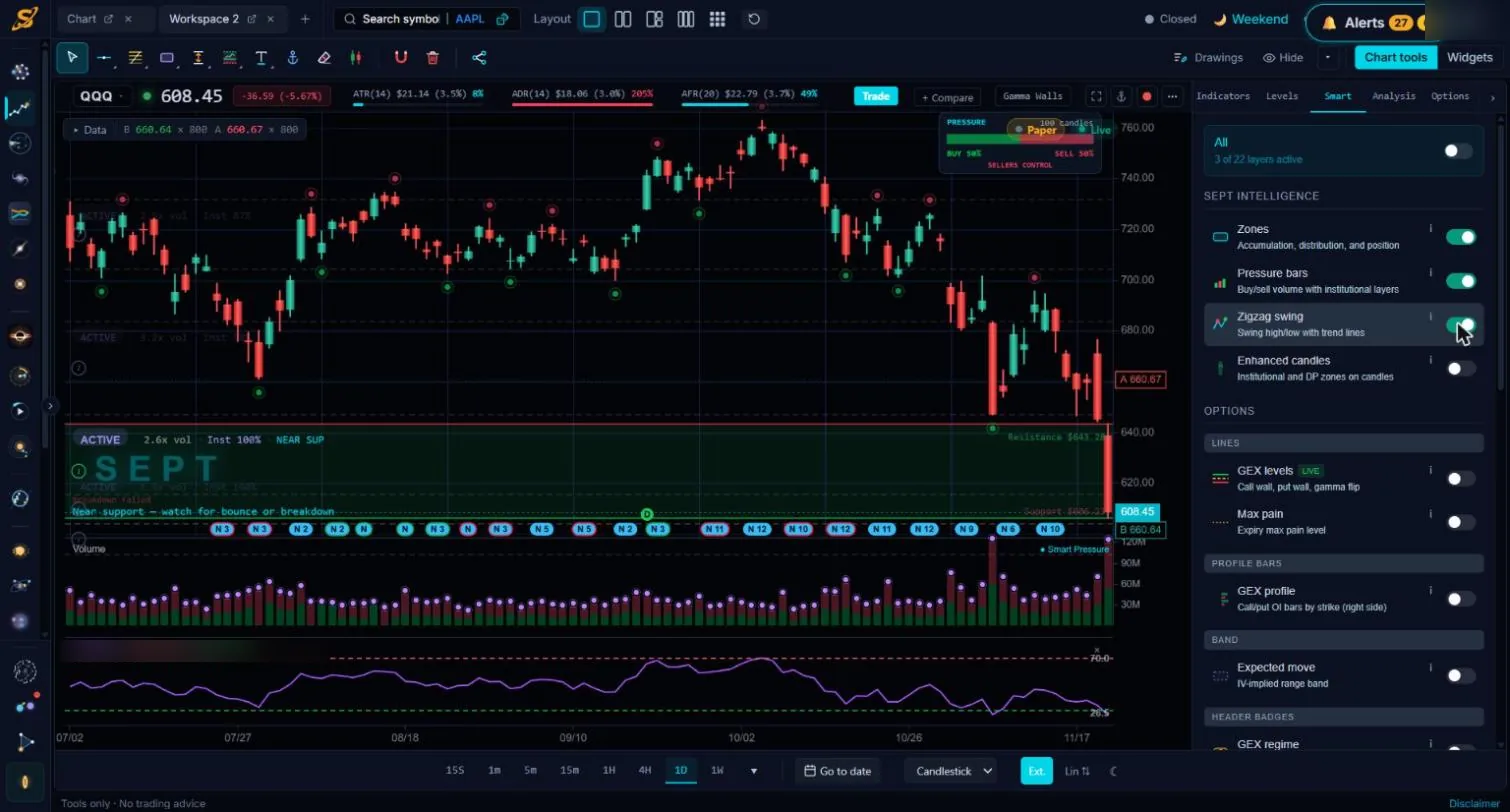
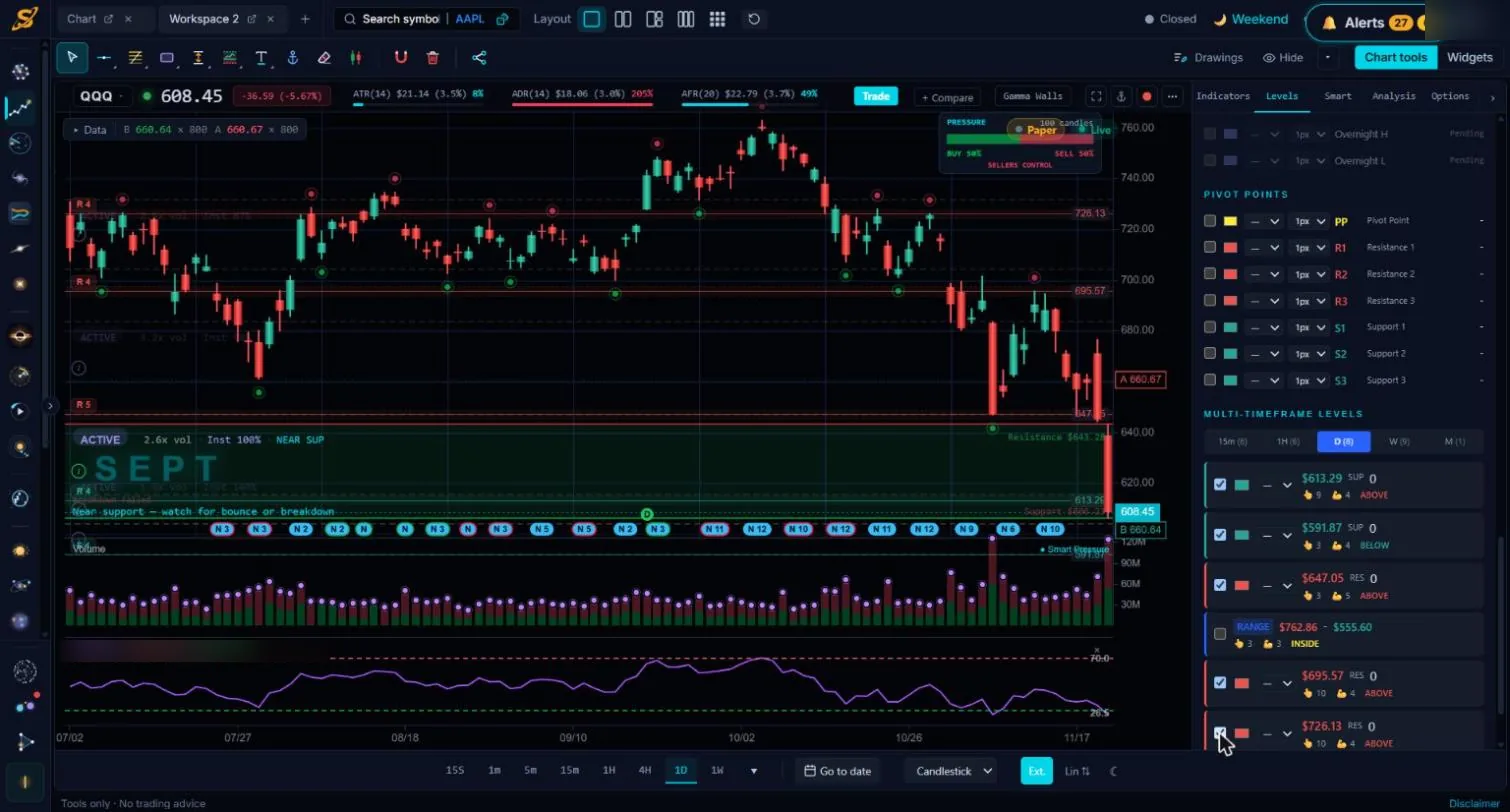
Key levels with their history, drawn for you
Multi-timeframe levels with history
Session levels
Volume profile
Auto trendlines and swings
Auto VWAP and Fibonacci retracement
Pivots, and only what you need
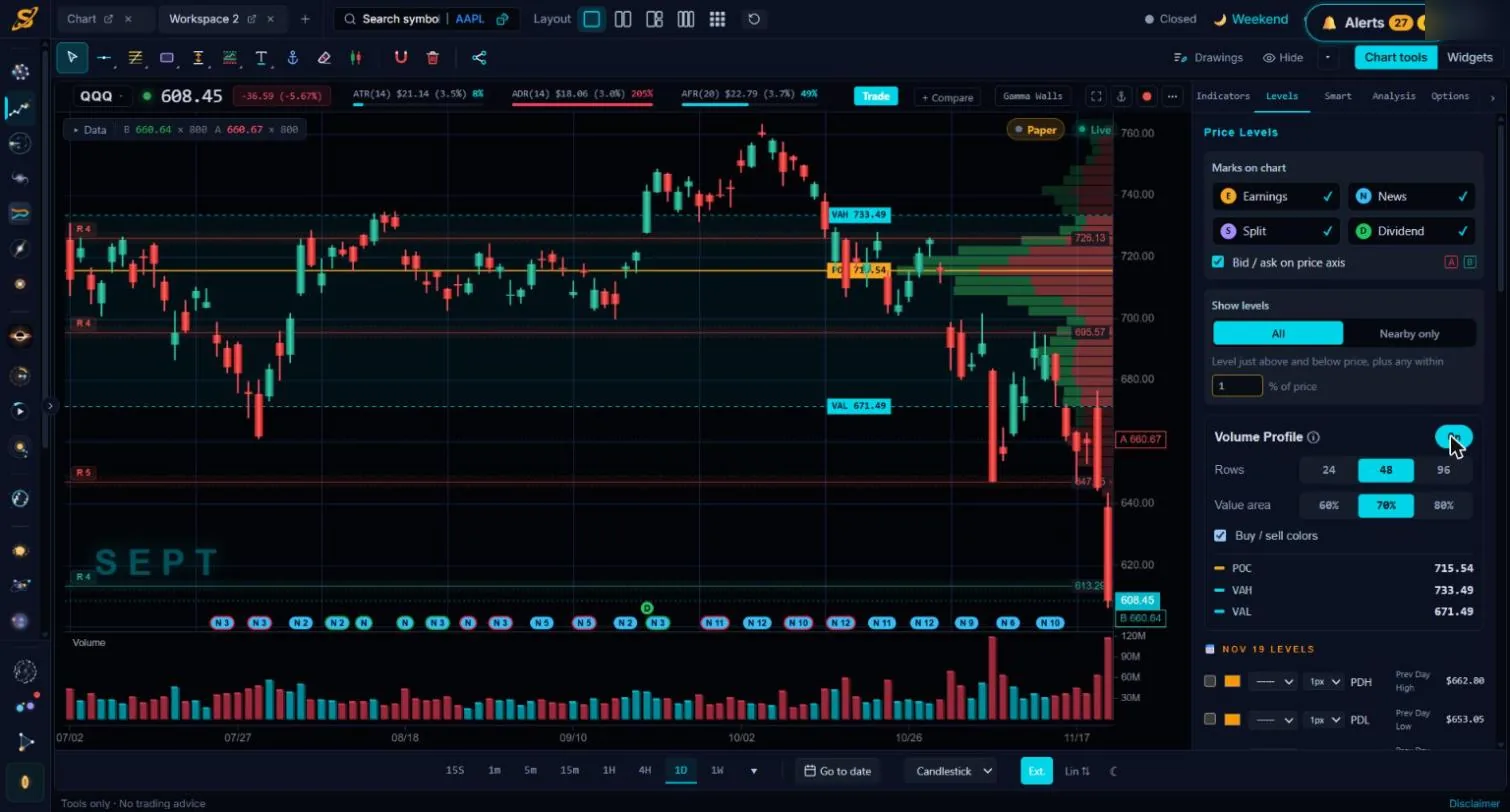
Drawn for you: one click
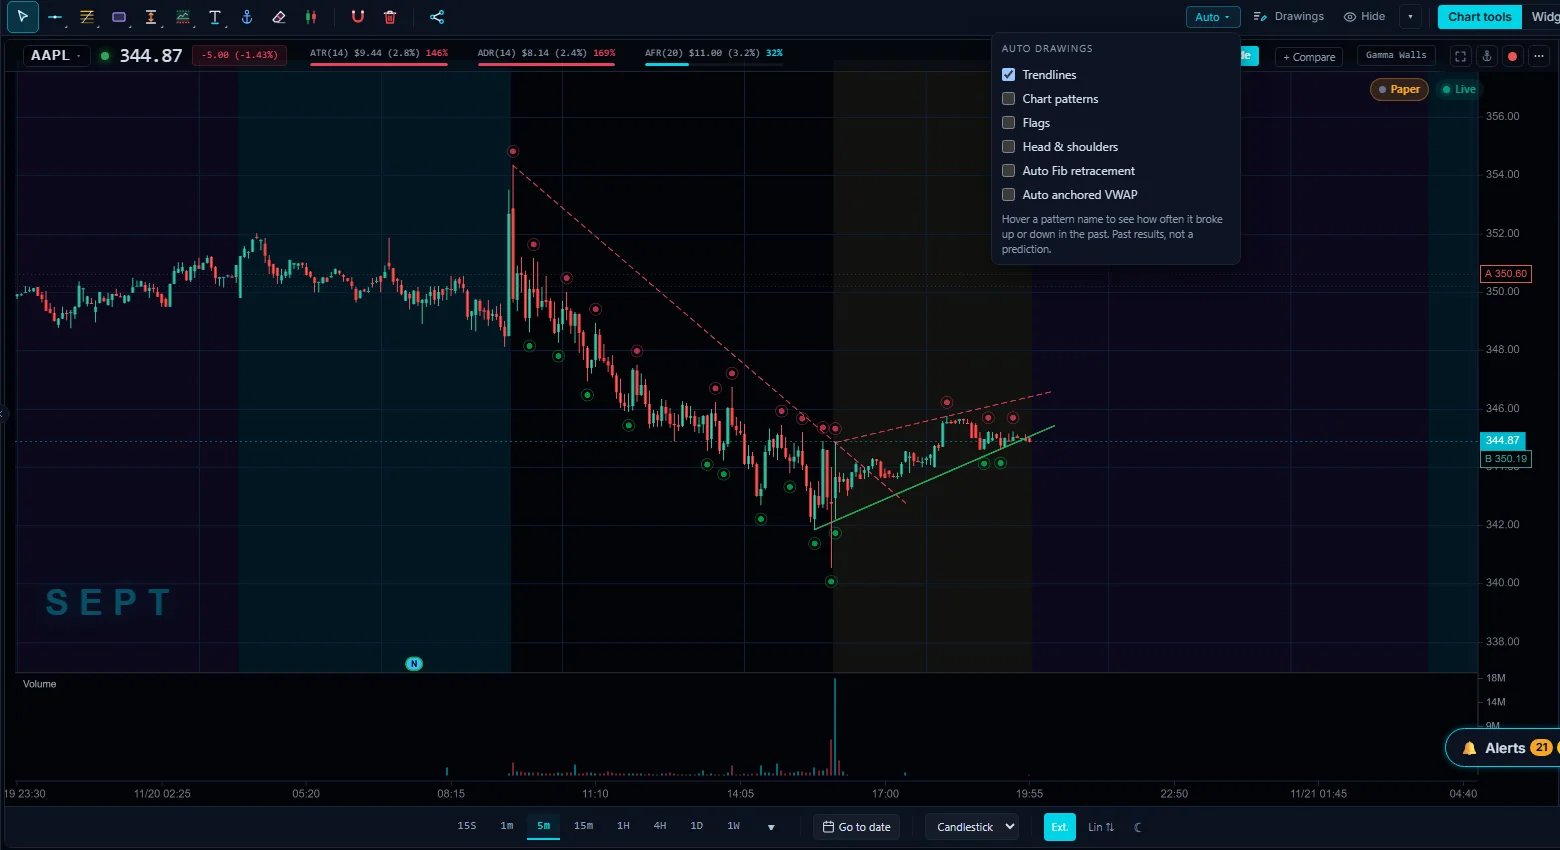
One ‘Auto’ menu draws trendlines, chart patterns (including flags and head & shoulders), Fibonacci retracement and anchored VWAP for you. Hover a pattern’s name to see how often that pattern broke up or down in the past: past results, not a prediction.
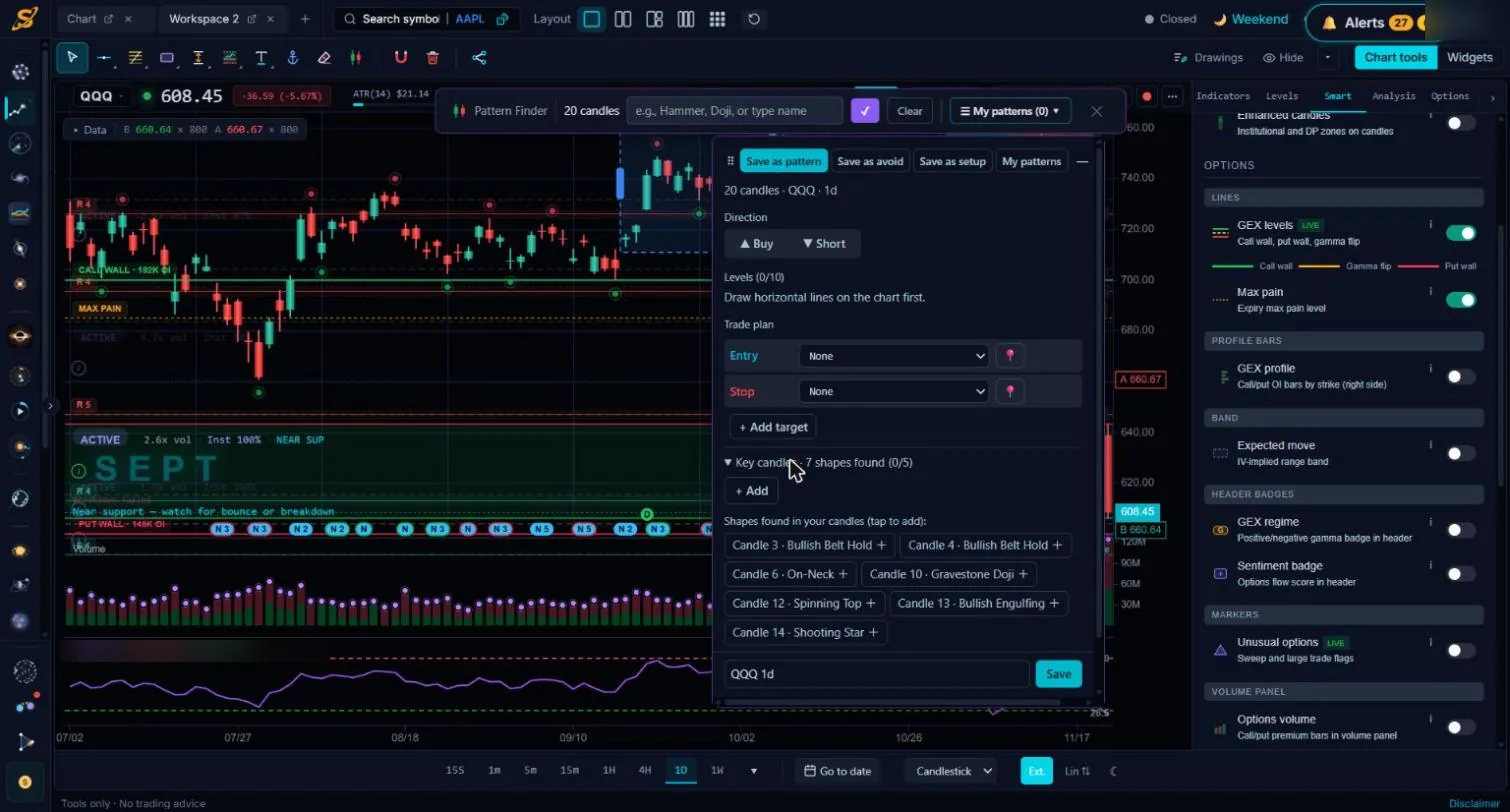
From candles on the chart to a setup you can test
- Select any stretch of candles. Pattern Finder lists the candlestick shapes inside them. Select 20 candles and it shows, for example, Bullish Engulfing, Gravestone Doji, Shooting Star and Spinning Top. It also learns the whole shape, including how long it took and its volume.
- Or pick a named pattern: candlestick patterns like Hammer, Morning Star or Evening Star, or chart patterns like flags and head & shoulders.
- Save it as a pattern, as an “avoid” pattern, or straight as a setup.
- Attach a trade plan: buy or short, up to 10 levels from lines on the chart, entry, stop and targets.
- Use it everywhere: screen and alert on it, backtest it, paper trade it, then let Full Autonomous Trading run it.
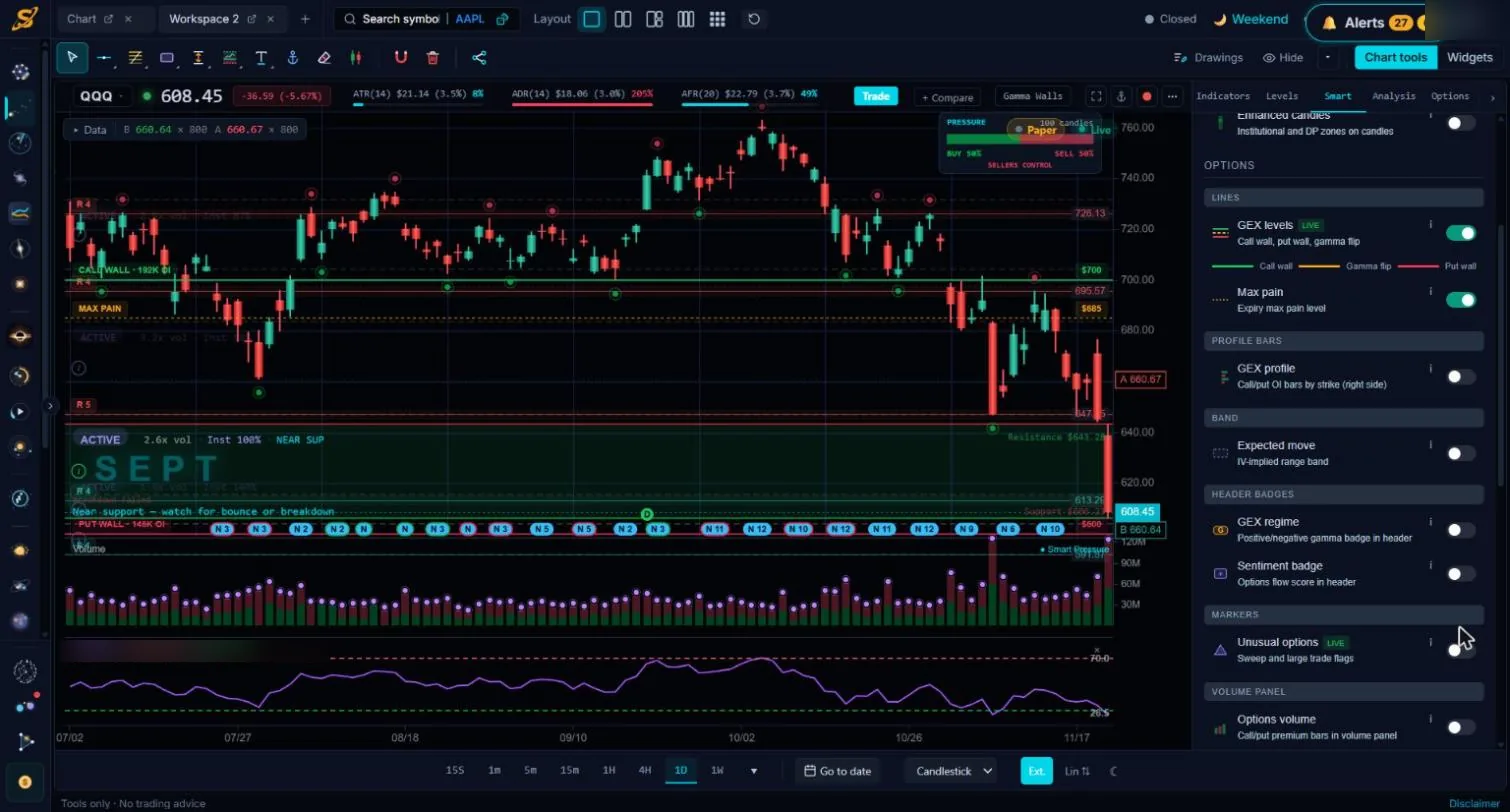
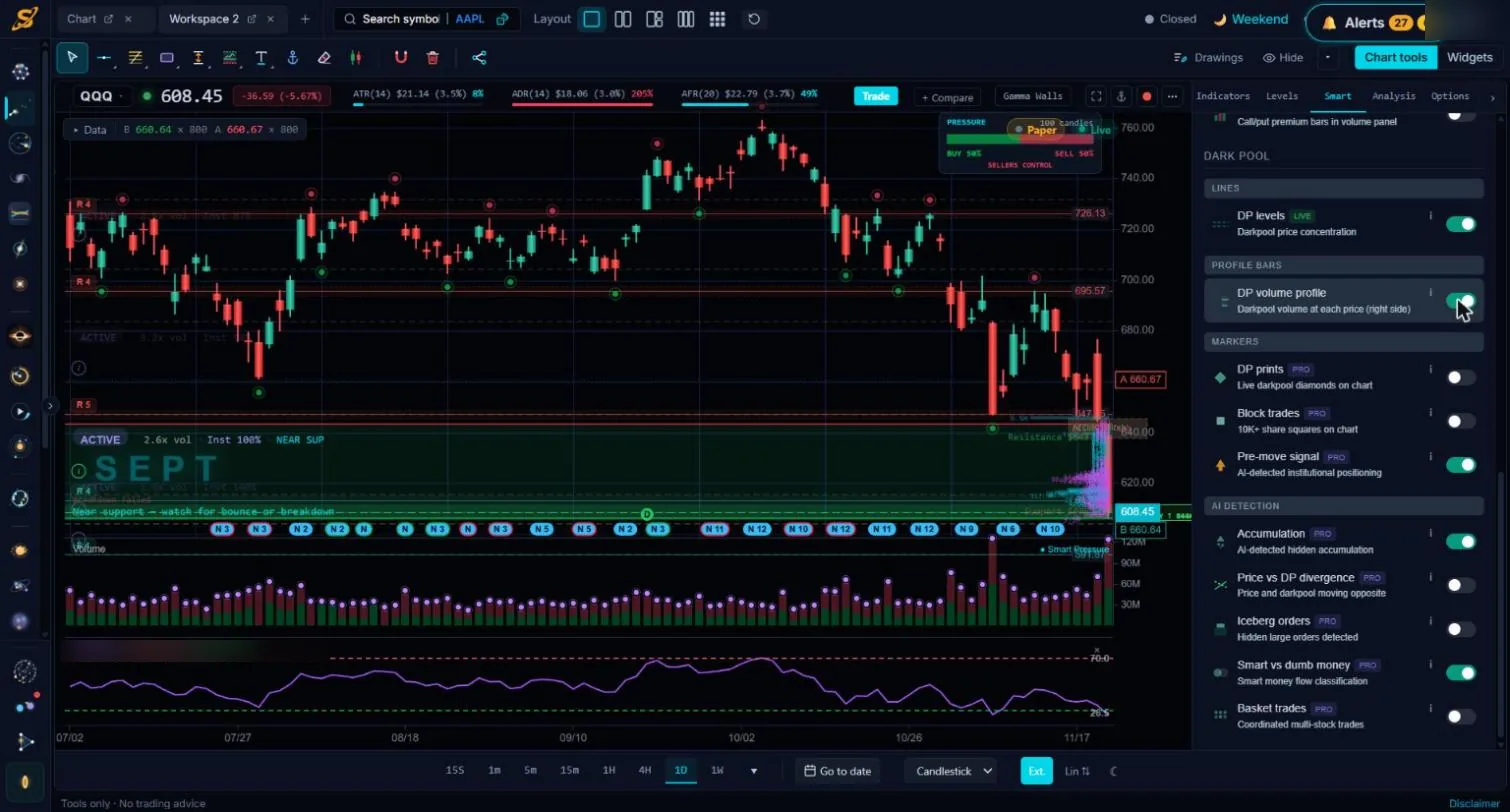
22 data layers, each with its own switch
Turn on only what you want to see. Options, dark-pool and AI layers are data that supports your own reading of price; SEPT does not give buy or sell signals.
Price action
Options data
Dark pool data
AI detectionPRO
Indicators, drawings and workspaces
77 built-in indicators
Custom indicators, no code
Drawings with alerts
Multi-chart workspaces
Timeframes and settings
Trade from the chart
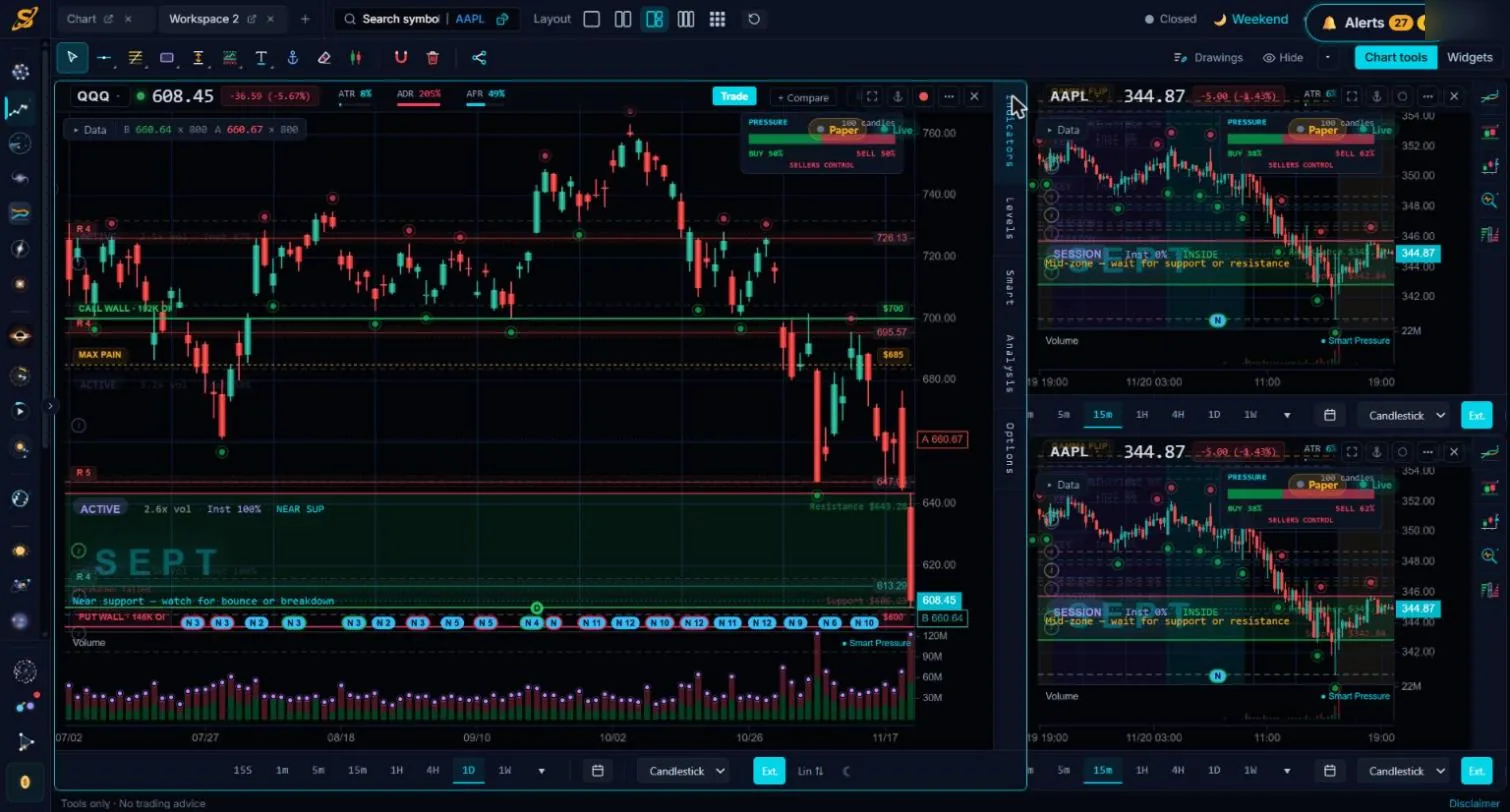
The chart is where setups start
Find it on the chart, then screen and alert on it, backtest it, prove it on paper, and trade it yourself or let Full Autonomous Trading run it. Every step uses the same price-action facts. See everything SEPT works out from price in the technical analysis overview, or compare it with other tools in best technical analysis software (2026).
Which plans include the chart
Every plan includes the chart. On the Free plan it refreshes every 15 minutes; paid plans are live. Options layers need a paid plan, and layers marked PRO need PRO or higher. See plans.
Chart questions
Does SEPT’s chart draw trendlines and patterns automatically?
Yes. Trendlines are drawn from SEPT’s swing points. Pattern Finder finds the candlestick shapes in any stretch of candles you select, and can look for chart patterns such as flags and head & shoulders.
Does SEPT show how often a pattern worked?
Yes. Hover a detected pattern’s name to see how often it broke up or down in the past. Past results, not a prediction.
What makes SEPT’s key levels different?
Each level comes with its history: how many times price touched it and how many times it held, on the 15-minute, 1-hour, daily, weekly and monthly charts. Buying vs. selling comes from real trades, not from the candle colour.
Can I set an alert on a line I drew?
Yes. Right-click a line you drew, or click it again, and choose “Alert on this line”.
Is the chart real time?
On paid plans the chart is live. On the Free plan it refreshes every 15 minutes. Options layers need a paid plan, and layers marked PRO need PRO or higher.
Can a pattern I find become a setup?
Yes. Save the candles as a pattern or straight as a setup, add direction, entry, stop and targets, then screen, alert, backtest and paper trade it.
Open a chart free
Start freeQuestions? Contact us.
Data and education only, no investment advice. SEPT provides tools only; all setups and trades are yours.