A setup that didn’t work — and how SEPT showed us why before any real money.
We built a long setup for low-priced stocks, tested it, then let Full Self-Trading run it on paper. It lost. Here is exactly what each SEPT screen showed, and what we’d change next.
Build the plan in plain words — seven steps
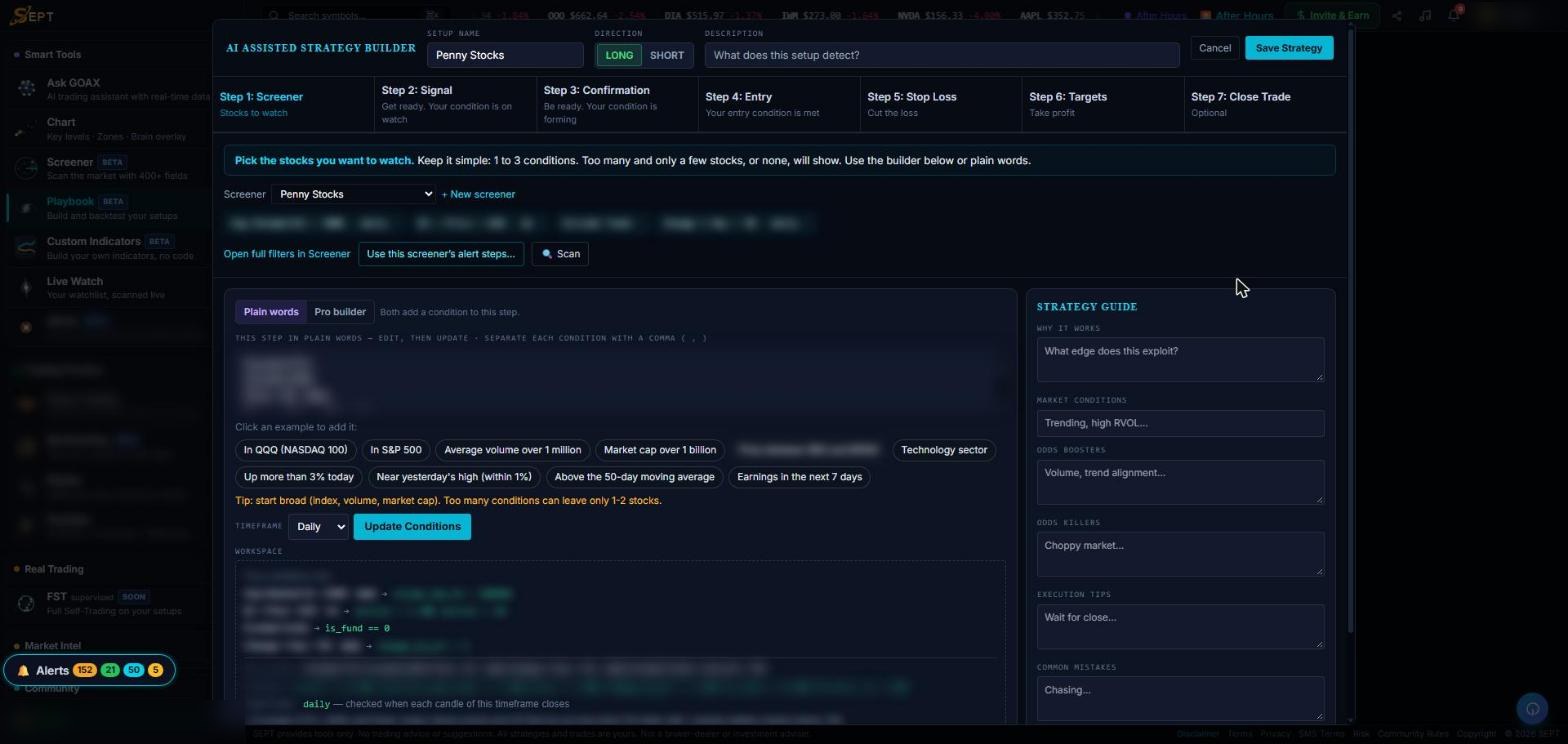
The Playbook builder walks you from the stocks to watch to the close of the trade. You type each step in plain words or use the pro builder; SEPT shows the exact rule before you save. (Rules blurred on purpose.)
- 1
Seven steps. Screener, signal, confirmation, entry, stop loss, targets, close trade.
- 2
Plain words or pro builder. Type it the way you think about it, or pick fields.
- 3
One-click examples to add common conditions.
- 4
Strategy guide to write down why it should work and what kills it.
The backtest said no — and showed where
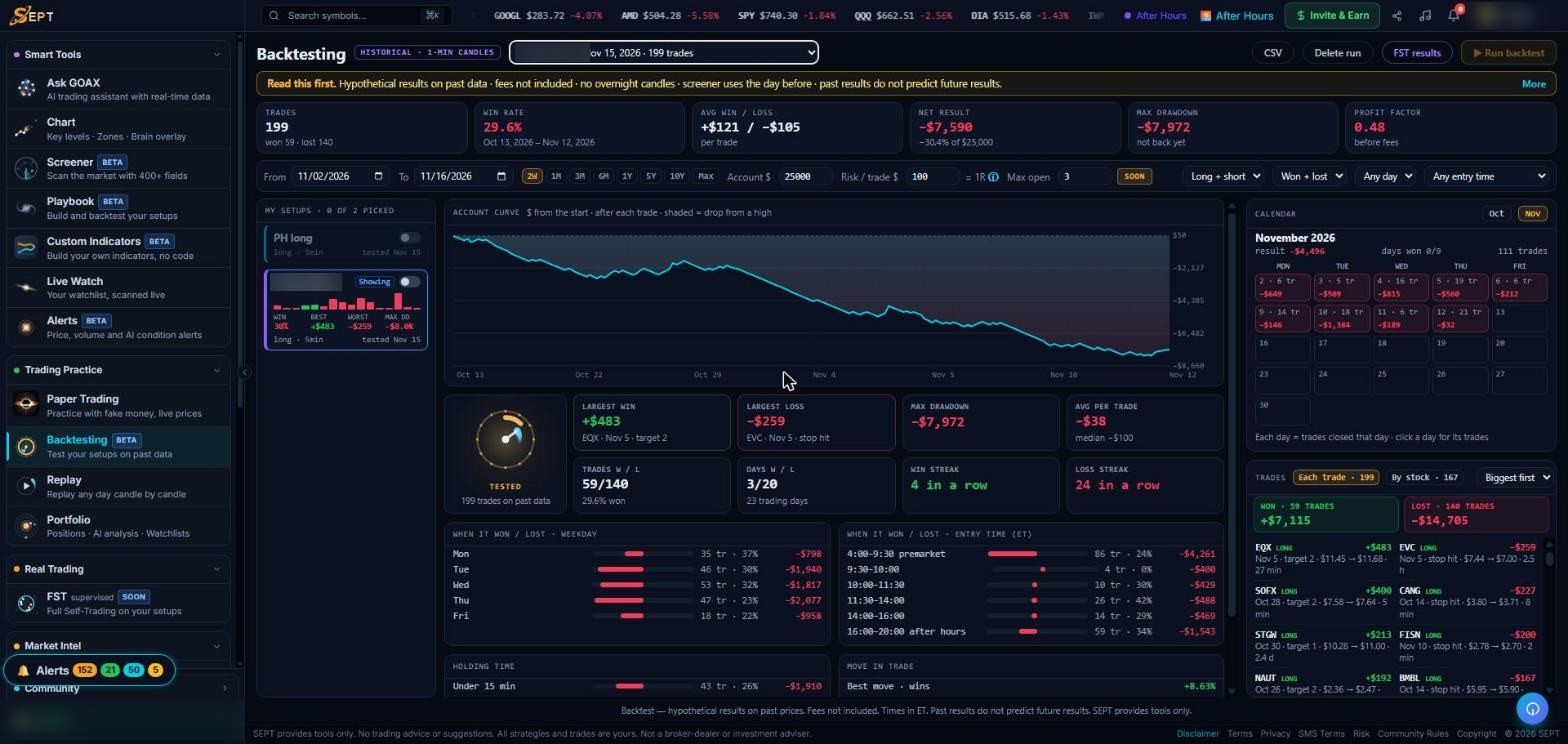
199 trades on 1-minute candles, sized at $100 risk per trade on a $25,000 account. The result was clearly negative, and the breakdown pointed straight at the problem.
- 1
Read this first. Every report says what the test does and doesn’t include.
- 2
Your account, your risk. Results sized by account size, risk per trade and max open trades.
- 3
Account curve with the drop from the high shaded.
- 4
Entry time. Premarket entries were 86 of 199 trades and the biggest loss.
- 5
Every trade listed — winners and losers, how each one exited.
Holding time and how far price moved
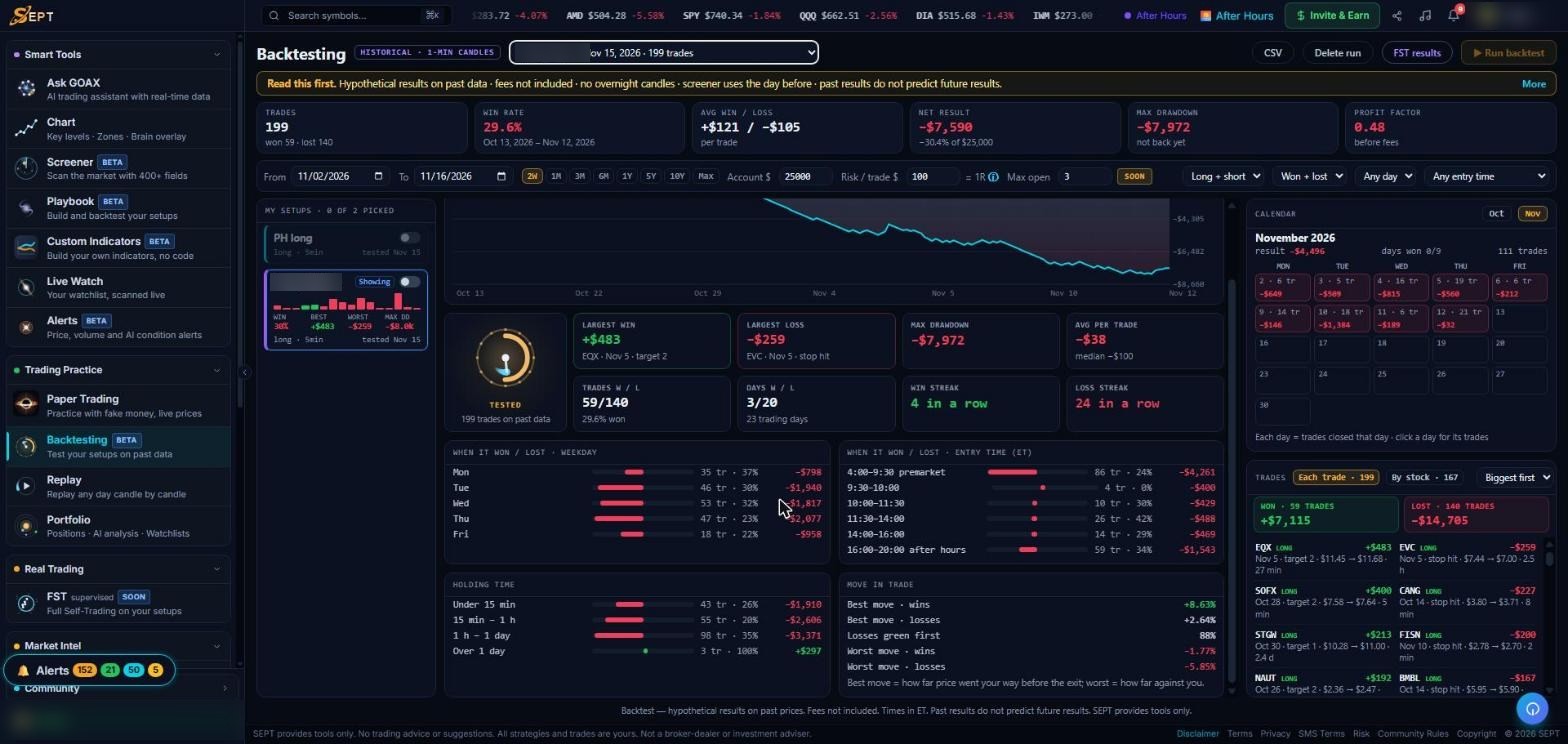
Below the curve, SEPT breaks the same trades down by holding time and by how far price moved for and against each trade.
- 1
Holding time. Short holds lost; the few trades held over a day were the only group that made money.
- 2
Losses green first: 88%. Most losing trades were in profit before they turned — a hint to take profit sooner.
- 3
Entry time again. The same premarket problem, from a second angle.
Then we let it run live — on paper
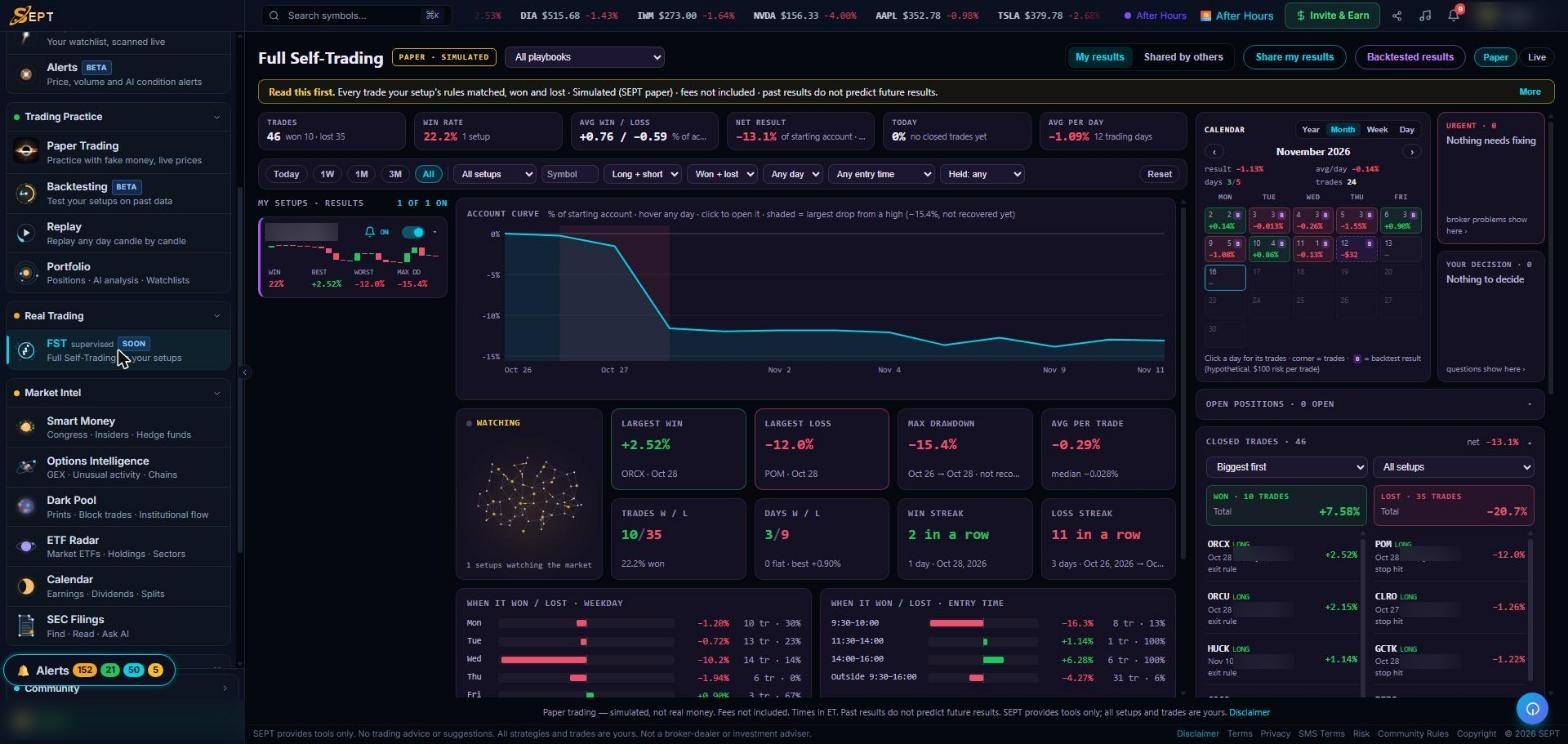
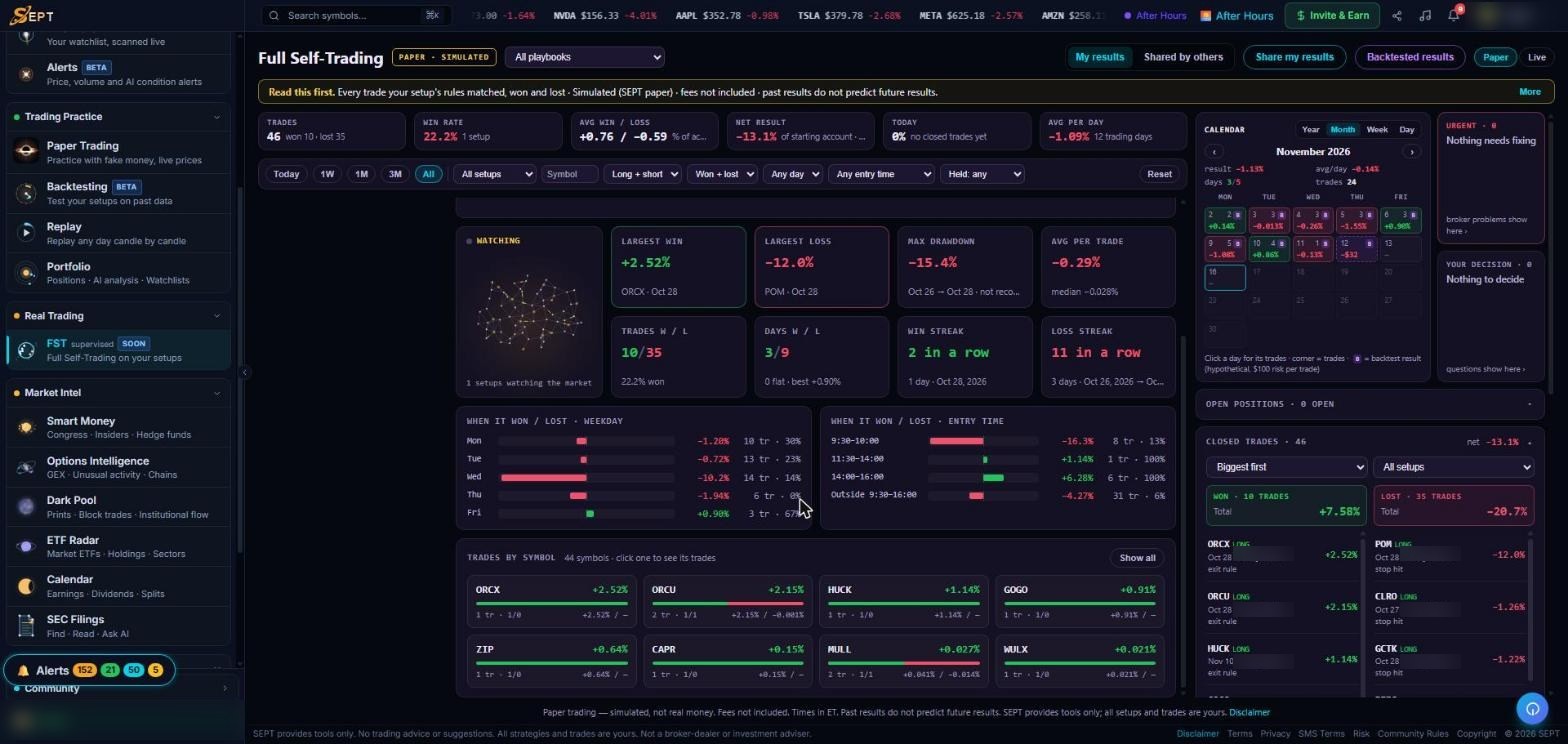
Full Self-Trading ran the same setup automatically in SEPT paper mode. Same rule, same data. The results matched what the backtest warned about.
- 1
Paper · Simulated. Clearly labeled. Your own broker account is coming soon.
- 2
Account curve with the largest drop shaded.
- 3
P&L calendar — click any day for its trades. Backtest days are marked too.
- 4
Urgent and your-decision panels for broker problems and anything that needs you.
- 5
Every closed trade with how it exited — target, stop or exit rule.
Live paper results pointed at the same fix
By entry time, the opening 30 minutes and entries outside regular hours lost; afternoon entries made money. Trades by symbol show where each result came from.
- 1
Opening 30 minutes: the biggest loss, as the backtest warned.
- 2
Afternoon entries were the group that made money.
- 3
Trades by symbol. Click one to see its trades.
- 4
Backtested results one click away, to compare live with the test.
The backtest warned. Paper trading confirmed. No real money lost.
What both screens agreed on
Early entries — premarket and the first 30 minutes — did most of the damage. Later entries did better. Most losing trades were in profit first.
What we’d change
Skip premarket and the opening 30 minutes, and look at taking part of the trade off sooner. In SEPT that’s one plain-words edit to the setup.
Then do it again
Re-run the backtest, paper trade it again, and only move to a broker account (coming soon) if both agree. Same rule, same data, every step.
Example only — not a recommendation to trade this or any setup. Backtest results are hypothetical on past data; paper results are simulated. Fees not included. Past results do not predict future results. SEPT provides tools only; all setups and trades are yours.
Test your own setup free