See the big orders behind the price.
Big orders often trade away from the public exchanges. SEPT tracks every dark pool print and large block, works out whether it was a buy or a sell, and shows the prices where the volume piled up.
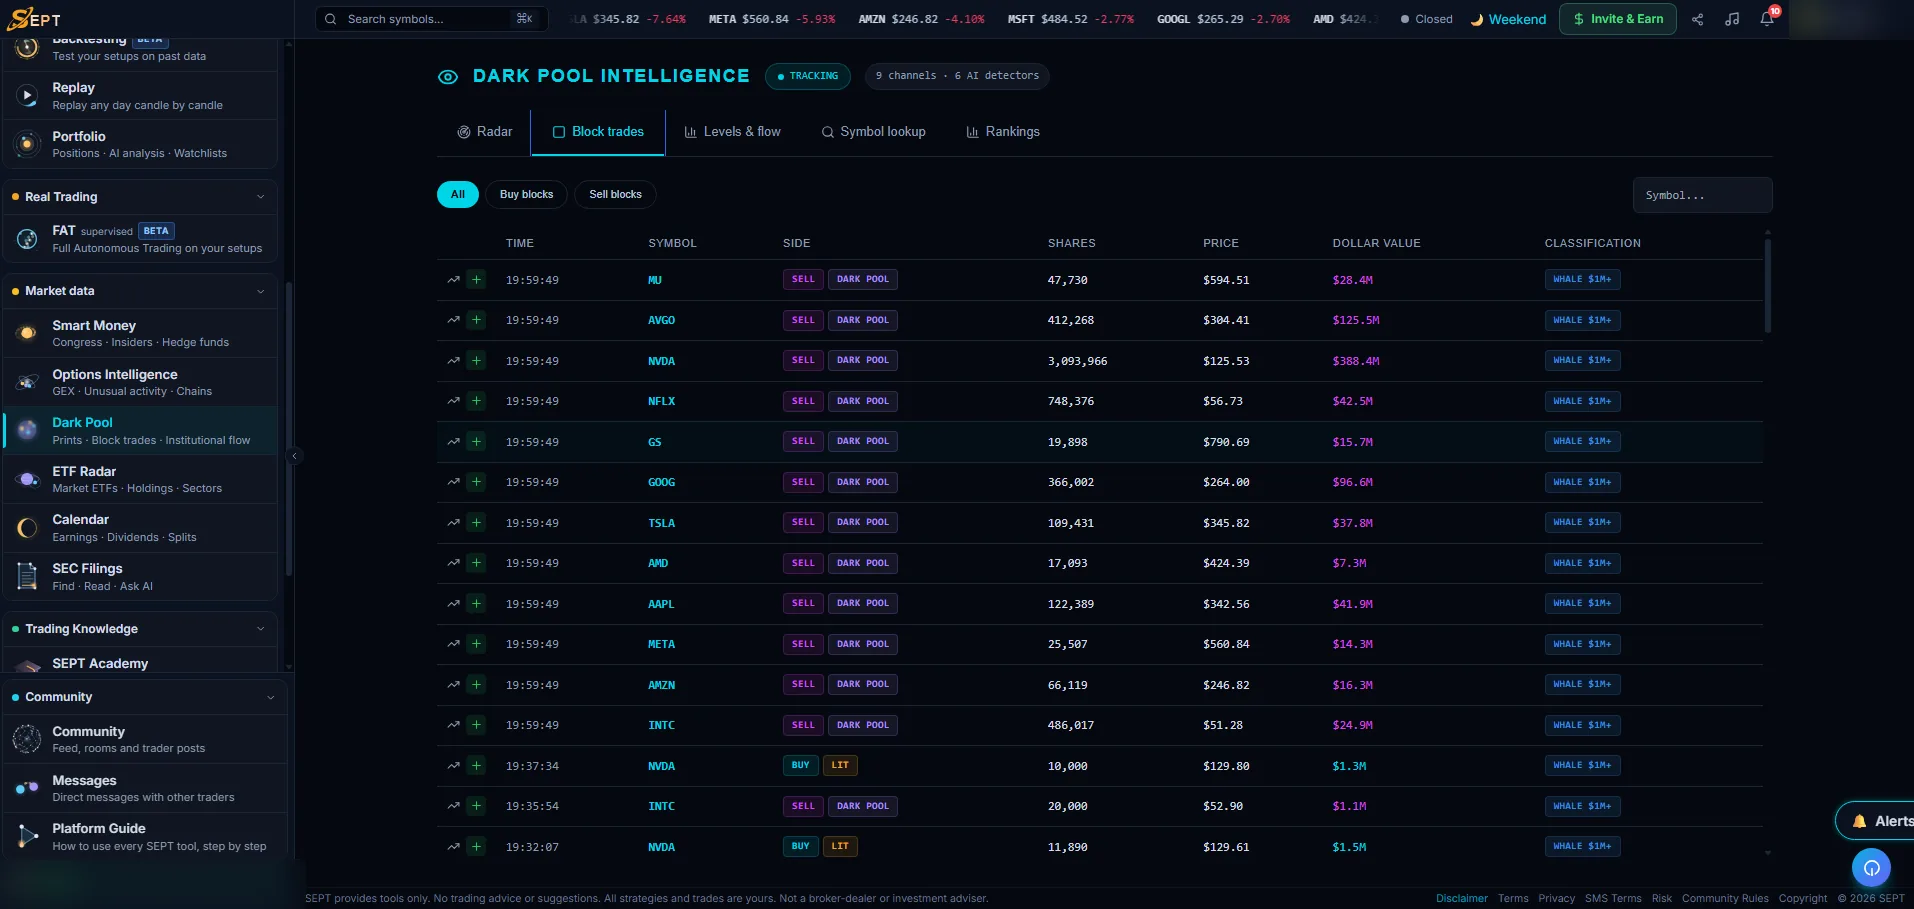
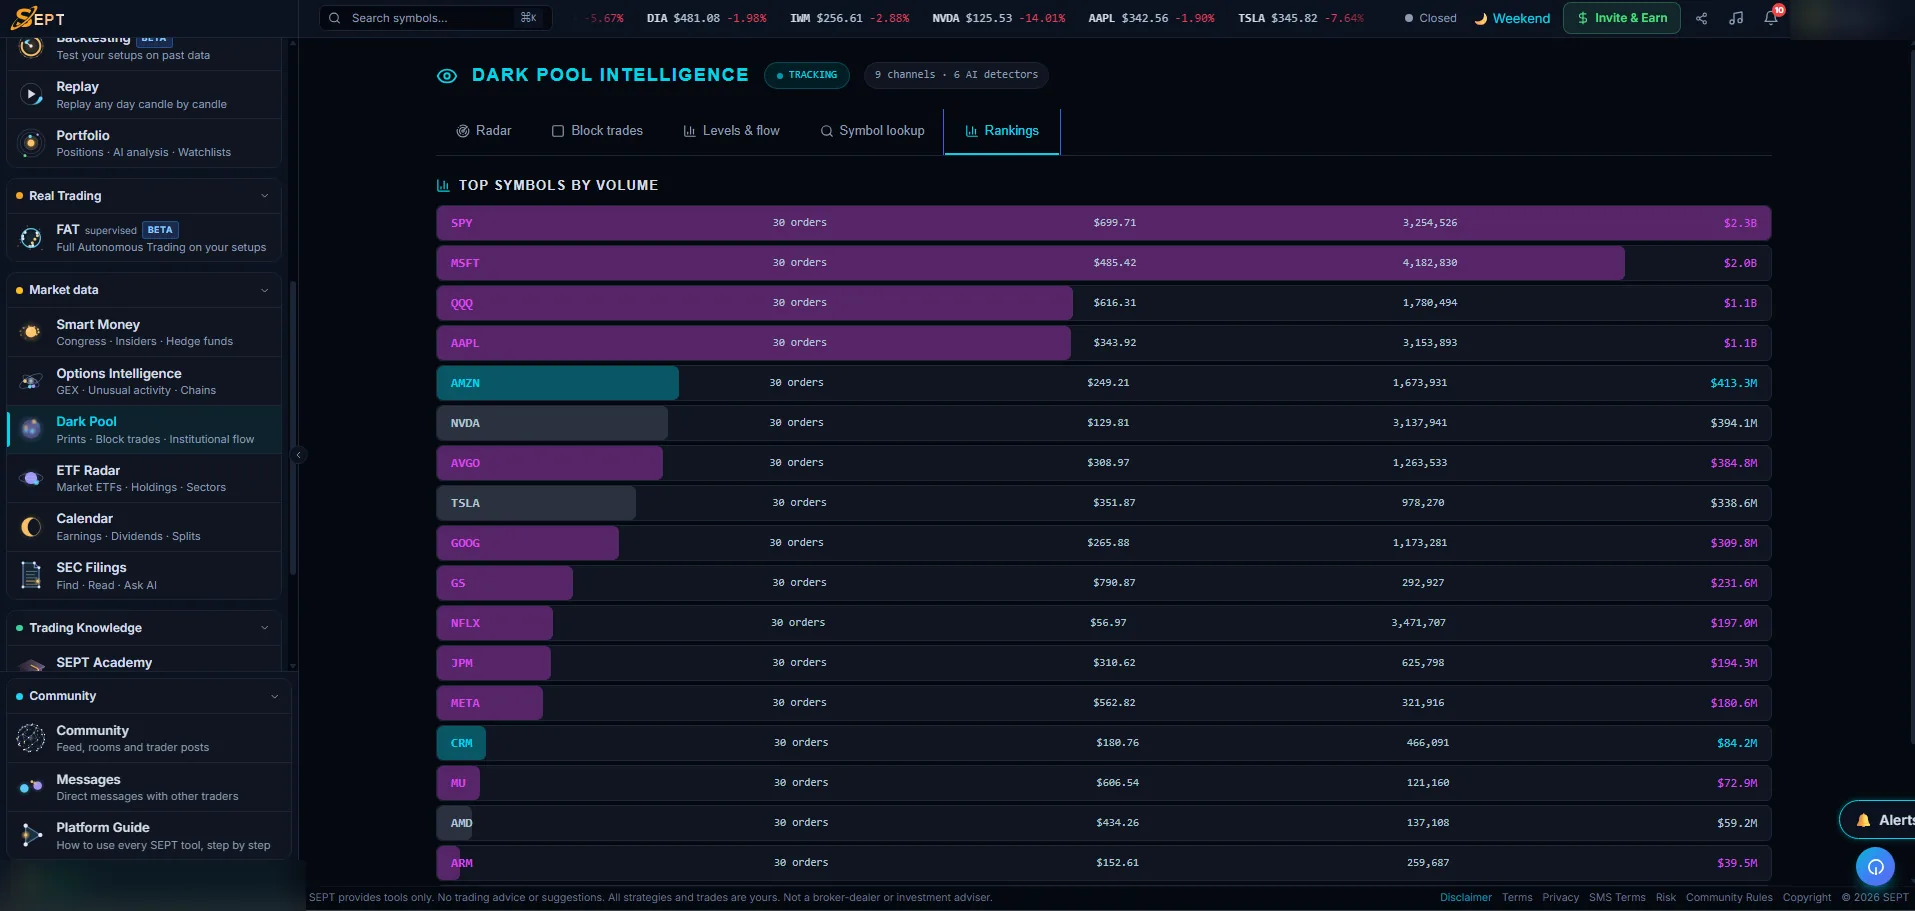
SEPT Investing’s Dark Pool page shows dark pool prints and 10,000+ share block trades as they happen, split into buys and sells by SEPT’s own estimate. It adds dark pool price levels for any stock, a cumulative flow timeline, 6 automatic detectors and rankings of the most active symbols.
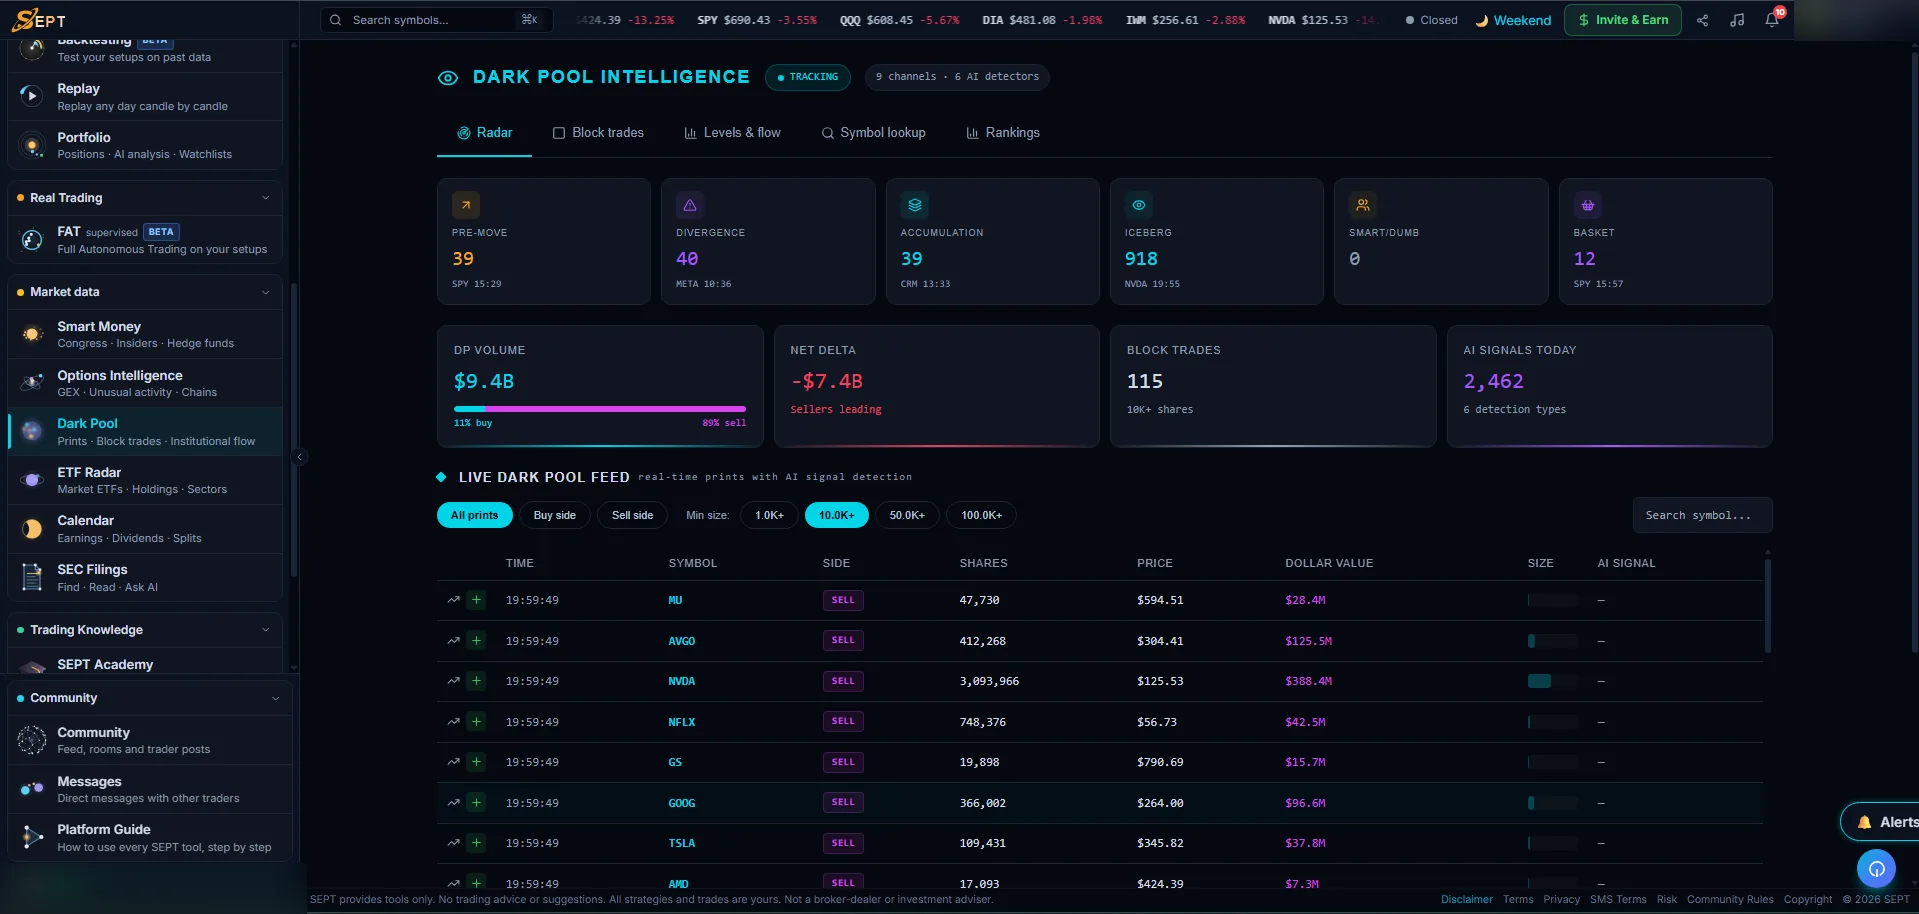
Every print and every large block
Live dark pool feed
Block trades
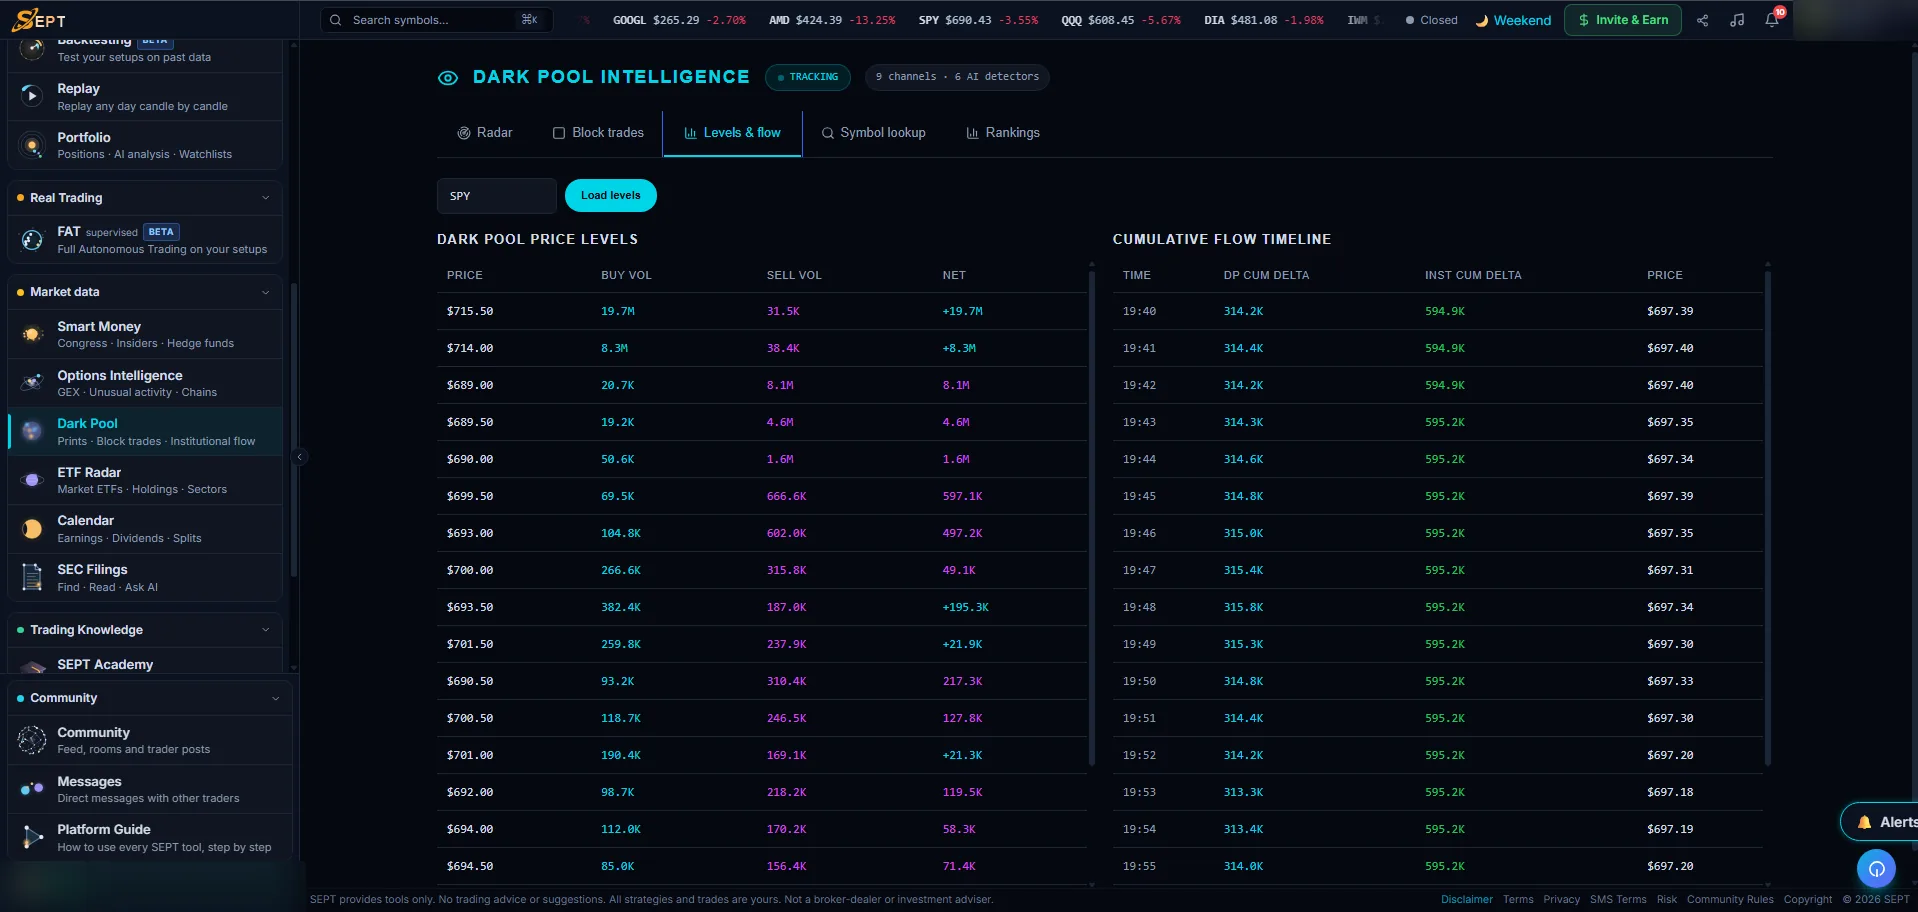
Where the volume piled up
Dark pool price levels
Cumulative flow timeline
6 automatic detectors
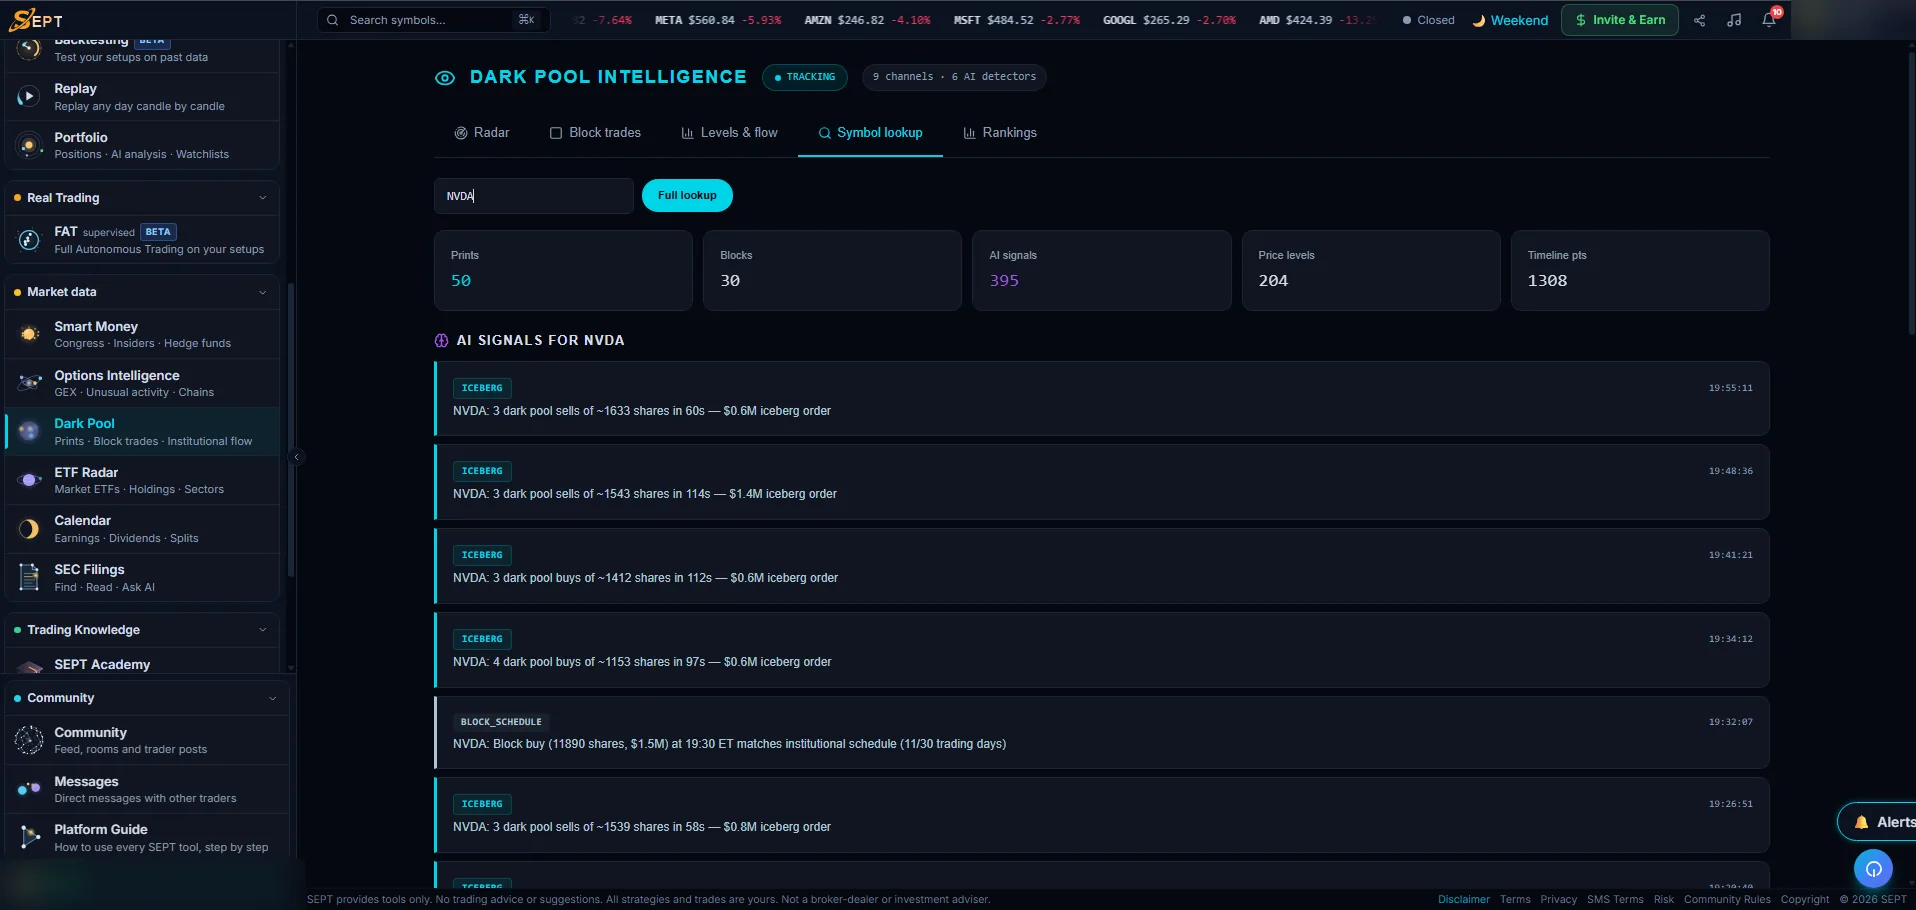
SEPT watches the prints for six kinds of pattern: Pre-move, Divergence, Accumulation, Iceberg, Smart/Dumb and Basket. Each match is listed as a signal, with a count per type for the day. A signal describes what happened in the prints. It is not a buy or sell call.
Iceberg
Block schedule
Symbol lookup and rankings
Symbol lookup
Rankings
On your chart, too
Dark pool levels and a dark pool volume profile show on the SEPT chart, and Pro adds dark pool prints and 10,000+ share block trades there too. Set alerts on the levels you draw, and see the options side in Options Intelligence.
Dark pool questions
What is a dark pool print?
A trade done off the public exchanges, then reported to the tape afterwards.
How does SEPT tell buys from sells?
It compares each print’s price with the quote at the time. It’s an estimate, not a reported field.
What counts as a block trade?
10,000 shares or more. Blocks of $1M or more are flagged as Whale.
Can I see dark pool levels for one stock?
Yes. Use Levels & flow or Symbol lookup. Dark pool levels also show on the SEPT chart.
See the dark pool flow free
Start freeQuestions? Contact us.
Data and education only, no investment advice. SEPT provides tools only; all setups and trades are yours. Buy and sell side is SEPT’s estimate from the quote at the time of each print.