Real GOAX answer · Nov 19, 2026, 5:22 PM ET
Please answer in English. What did Walmart's 8-K filed today say about its Q3 results and new full-year outlook? How did $WMT close today versus yesterday's close, and where are its key levels?
Please answer in English. What did Walmart's 8-K filed today say about its Q3 results and new full-year outlook? How did $WMT close today versus yesterday's close, and where are its key levels?
GOAX
Walmart 8-K (filed Nov 19, Item 2.02, signed by CFO John David Rainey): Q3 results for the three and nine months ended October 31, 2026 — revenue $188.8B, up 5.2% (up 4.5% in constant currency); operating income up 16.0%; global eCommerce up 17%; GAAP EPS $0.62, adjusted EPS $0.65. Full-year outlook was raised: net sales growth 4.9%–5.2%, adjusted operating income growth 8.0%–8.6% in constant currency, adjusted EPS $2.84–$2.89. The company noted the timing of Flipkart's Big Billion Days shifted comparisons, with the benefit expected in Q4. Items flagged in the release: inventory growth of 8.1%, free cash flow down $2.0B, and the bundled Walmart+/Sam's Club Plus membership expected to weigh on Sam's Club operating income growth until lapped in Q3 fiscal 2028.
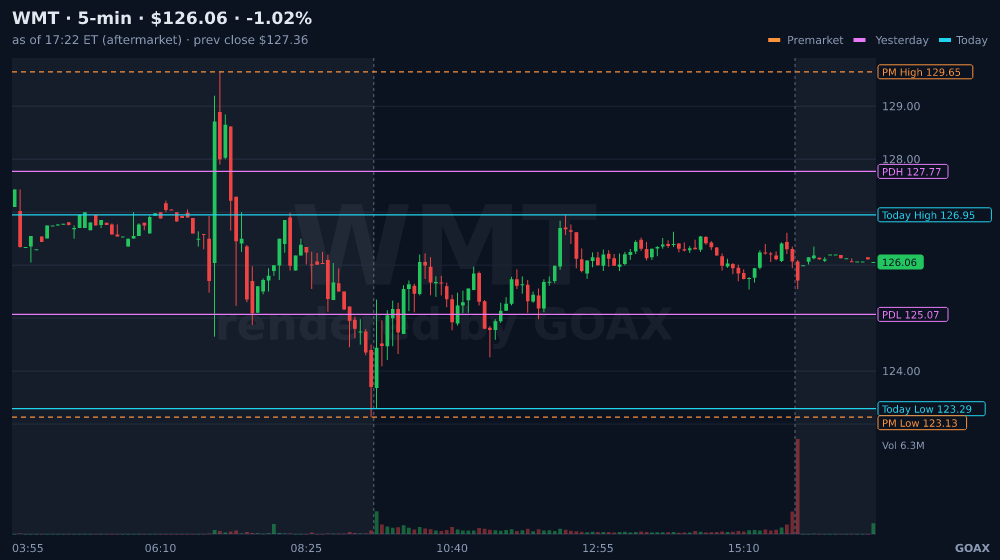
Price: WMT closed today at $126.04, down -1.04% from yesterday's close of $127.36 (now $126.06 after hours, +0.02%). So it fell on an earnings beat and a raised outlook — the move did not follow the headline.
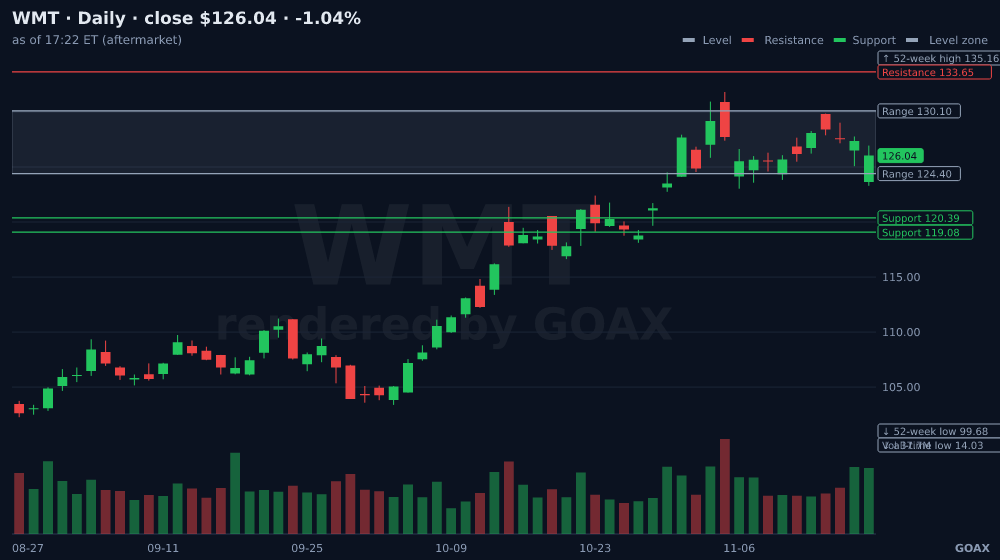
Where it sits: WMT is trading inside the range 124.40–130.10, in the middle 50%, where direction is undecided. It broke down out of the range 127.39–131.82 on Nov 17 and is now inside the wider range; a daily close back above 127.39 means that break failed. Today's candle closed in the upper part of its range (body 66%, high 126.95, low 123.29).
Levels that decide the next move:
• Close above 130.10 → next levels above: 131.82, then 133.65, then 135.16 (52-week and all-time high, 2026-05-19). In our data, breakouts keep going about 4 in 10; about half fall back inside, and fakes usually return within 1–2 days. The next candle is the tell: no new high → about 3 in 4 fail.
• Close below 124.40 → next levels below: 121.95, 121.30, 120.39, then 120.00. Break-downs keep going slightly less than breakouts. Stacked support sits just under 124.40 — watch for a bullish candle there.
• Below that, the active zone 120.39–125.80 is the bigger support area; the up-trend only ends when, after a lower high, a confirmed swing low forms below 118.11.
Also worth knowing: open interest is 360K calls vs 249K puts, max pain $115, put wall $110, call wall $120, gamma flip $125 — price is above all of those. Dark pool showed an urgent buy (50 trades, 60% above mid).
Bottom line: a daily close above 130.10 or below 124.40 decides the next swing move — until then, the middle of the range is undecided.
SEPT only provides tools. No trading advice or suggestions. Full disclaimer
Price: WMT closed today at $126.04, down -1.04% from yesterday's close of $127.36 (now $126.06 after hours, +0.02%). So it fell on an earnings beat and a raised outlook — the move did not follow the headline.
Where it sits: WMT is trading inside the range 124.40–130.10, in the middle 50%, where direction is undecided. It broke down out of the range 127.39–131.82 on Nov 17 and is now inside the wider range; a daily close back above 127.39 means that break failed. Today's candle closed in the upper part of its range (body 66%, high 126.95, low 123.29).
Levels that decide the next move:
• Close above 130.10 → next levels above: 131.82, then 133.65, then 135.16 (52-week and all-time high, 2026-05-19). In our data, breakouts keep going about 4 in 10; about half fall back inside, and fakes usually return within 1–2 days. The next candle is the tell: no new high → about 3 in 4 fail.
• Close below 124.40 → next levels below: 121.95, 121.30, 120.39, then 120.00. Break-downs keep going slightly less than breakouts. Stacked support sits just under 124.40 — watch for a bullish candle there.
• Below that, the active zone 120.39–125.80 is the bigger support area; the up-trend only ends when, after a lower high, a confirmed swing low forms below 118.11.
Also worth knowing: open interest is 360K calls vs 249K puts, max pain $115, put wall $110, call wall $120, gamma flip $125 — price is above all of those. Dark pool showed an urgent buy (50 trades, 60% above mid).
Bottom line: a daily close above 130.10 or below 124.40 decides the next swing move — until then, the middle of the range is undecided.
SEPT only provides tools. No trading advice or suggestions. Full disclaimer
Data GOAX checked✓ Sec filings✓ Price & zones✓ News
Copied exactly as GOAX answered at 5:22 PM ET on Nov 19, 2026. Market data changes during the day.
WMT on SEPT
More real GOAX answers
- Please answer in English. How did the overall market (SPY, QQQ) do today, and which big-name stocks moved the most and why? · Nov 19, 2026
- Please answer in English. Why did the market drop again today, and what happened with $AMD today? Where are its key levels into tomorrow? · Nov 19, 2026
- Please answer in English. Stocks were up early today and then reversed hard, with the Dow down over 1,000 points. Why did the market reverse, and where are $SPY's key levels into tomorrow? · Nov 19, 2026
Ask GOAX your own question
GOAX reads SEPT's real-time computed data: key levels, real buying vs. selling, flow and filings.
Try GOAX freeWeekly: key levels to watch + one trader question answered. Free.
We email a confirm link first. Unsubscribe any time. Tools and data, not investment advice.
Tools and data, not investment advice. Past results don't predict future results.