Real GOAX answer · Nov 19, 2026, 4:29 PM ET
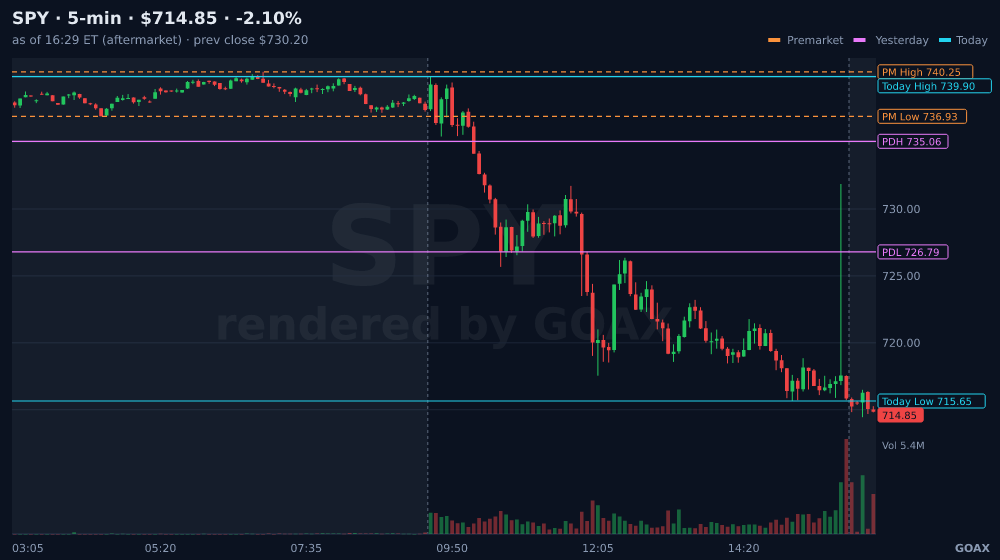
Please answer in English. Stocks were up early today and then reversed hard, with the Dow down over 1,000 points. Why did the market reverse, and where are $SPY's key levels into tomorrow?
Please answer in English. Stocks were up early today and then reversed hard, with the Dow down over 1,000 points. Why did the market reverse, and where are $SPY's key levels into tomorrow?
GOAX
The reversal has a macro driver, not a stock one. The market is pricing a 92% chance of a 25 bps Fed rate hike in December, up 4 points in the past week — that repricing of tighter policy is the backdrop behind a rally that got sold. SPY opened higher and closed down at 715.87 (-2.93% on the day, 67.1M shares), a near-full-body red candle (body 89%, upper wick 10%, lower wick 1%) — sellers took it straight down with almost no lower wick. Note that this move has already consumed about 123% of the daily ATR, so it is stretched; that is a caution flag on chasing the move further, not a reason to ignore the trend.
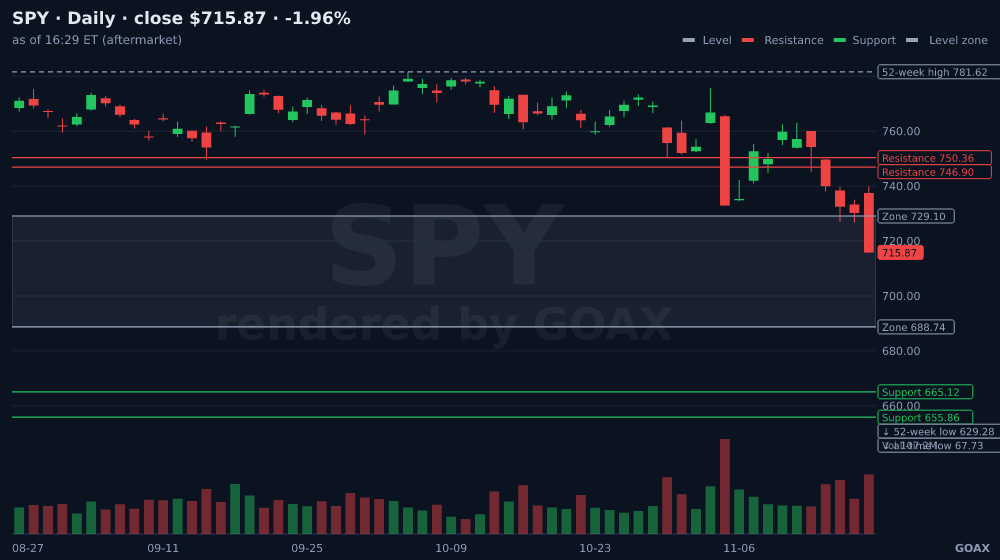
Here is where SPY stands structurally. Yesterday's close at 730.20 broke DOWN out of the range 729.10–742.68, and today price fell into the key range 688.74–729.10, closing in the middle 50% — which means direction is undecided until an edge gives way. Right now the readings conflict: the daily trend and the 5-minute structure are both bearish (lower highs and lower lows), but the hourly is still bullish and the 15-minute pressure is accumulation. That mix says the daily is deciding, not resolved.
Levels into tomorrow:
• Above: if price closes back above 729.10 (the top of the range, +2.0%), the breakdown has failed, and the levels above to watch are 732.71, 735.52, 740.00, 742.68 — those sit stacked and price may stall there. Next resistance beyond that is 746.90.
• Below: a daily close below 688.74 (range low, -3.7%) opens the next level down at 684.77, then 680.00, 678.13, 675.56. The zone at 678.13–688.74 is active support, and the daily zone 651.89–675.56 is the stronger shelf under it.
Odds, from our data: a break above 729.10 keeps going about 4 in 10; a break below 688.74 keeps going about 40 in 100. The next daily candle is the tell — if it cannot make a new low after a break down, most of those breaks fail; two closes below the level and most keep going. Fakes usually come back inside the range within 1–2 days.
Options lean bearish (2.18 put/call), price is 4.7% below max pain at 750, and there is unusual put buying in the 696 strike expiring Nov 30. Dark pool flow after the close was net buying, 56% above mid.
Bottom line: 729.10 above and 688.74 below are the two lines that decide the next swing move; price is sitting undecided in between, and the move already used more than a full day's range.
SEPT only provides tools. No trading advice or suggestions. Full disclaimer
Here is where SPY stands structurally. Yesterday's close at 730.20 broke DOWN out of the range 729.10–742.68, and today price fell into the key range 688.74–729.10, closing in the middle 50% — which means direction is undecided until an edge gives way. Right now the readings conflict: the daily trend and the 5-minute structure are both bearish (lower highs and lower lows), but the hourly is still bullish and the 15-minute pressure is accumulation. That mix says the daily is deciding, not resolved.
Levels into tomorrow:
• Above: if price closes back above 729.10 (the top of the range, +2.0%), the breakdown has failed, and the levels above to watch are 732.71, 735.52, 740.00, 742.68 — those sit stacked and price may stall there. Next resistance beyond that is 746.90.
• Below: a daily close below 688.74 (range low, -3.7%) opens the next level down at 684.77, then 680.00, 678.13, 675.56. The zone at 678.13–688.74 is active support, and the daily zone 651.89–675.56 is the stronger shelf under it.
Odds, from our data: a break above 729.10 keeps going about 4 in 10; a break below 688.74 keeps going about 40 in 100. The next daily candle is the tell — if it cannot make a new low after a break down, most of those breaks fail; two closes below the level and most keep going. Fakes usually come back inside the range within 1–2 days.
Options lean bearish (2.18 put/call), price is 4.7% below max pain at 750, and there is unusual put buying in the 696 strike expiring Nov 30. Dark pool flow after the close was net buying, 56% above mid.
Bottom line: 729.10 above and 688.74 below are the two lines that decide the next swing move; price is sitting undecided in between, and the move already used more than a full day's range.
SEPT only provides tools. No trading advice or suggestions. Full disclaimer
Data GOAX checked✓ Morning brief✓ Price & zones✓ News✓ Prediction odds
Copied exactly as GOAX answered at 4:29 PM ET on Nov 19, 2026. Market data changes during the day.
SPY on SEPT
More real GOAX answers
Ask GOAX your own question
GOAX reads SEPT's real-time computed data: key levels, real buying vs. selling, flow and filings.
Try GOAX freeWeekly: key levels to watch + one trader question answered. Free.
We email a confirm link first. Unsubscribe any time. Tools and data, not investment advice.
Tools and data, not investment advice. Past results don't predict future results.