Real GOAX answer · Nov 20, 2026, 6:39 PM ET
Please answer in English. Taiwan Semiconductor ($TSM) just finished its worst week in a long time and closed down about 9% today. Is it bouncing after hours, what's behind the selloff this week, and what levels matter going into Monday?
Please answer in English. Taiwan Semiconductor ($TSM) just finished its worst week in a long time and closed down about 9% today. Is it bouncing after hours, what's behind the selloff this week, and what levels matter going into Monday?
GOAX
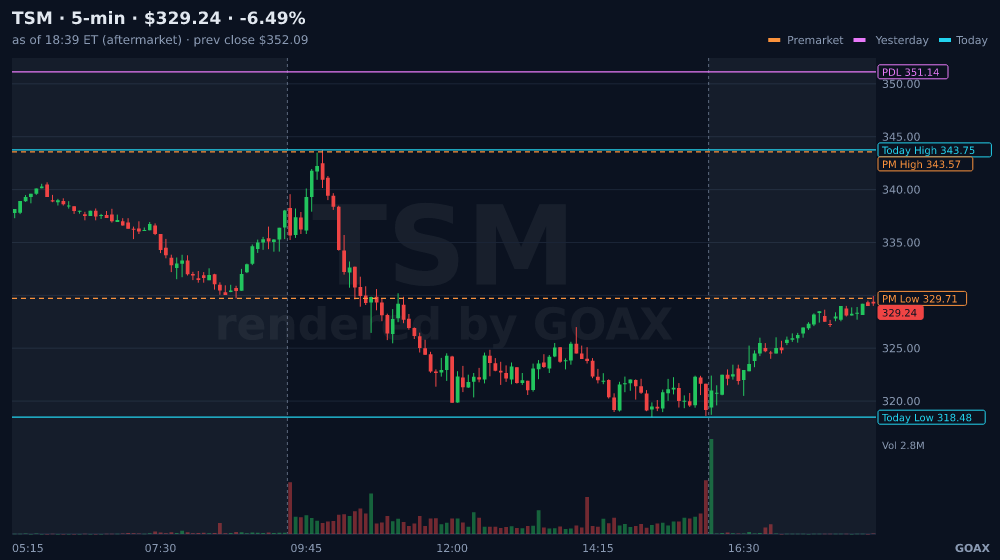
Yes, it is bouncing after hours — TSM is at $329.28, up 3.32% from the $318.71 close, after a session that fell 9.48% from $352.09 on volume of 33.9M shares. That down move is about 120% of ATR(14) $19.05, so today's selling is already an extended move, not a fresh setup.
What's behind the week: the news points to the new US export rules tightening AI chip exports to five countries and hitting chips at 16nm. Benzinga reported (Nov 20) that Taiwan's main index fell 6.2% Friday for a roughly 17.5% weekly decline — its worst week since 1990 — with TSMC down 4.8% in Taipei Friday and 15.8% on the week. A Trefis piece (Nov 20) notes this was TSM's worst week since March 2020. Note the earnings flag in the news feed is not the driver — TSMC already reported Q3 on Oct 15 (6-K), with October revenue up 59.7% year-over-year (6-K, Nov 10).
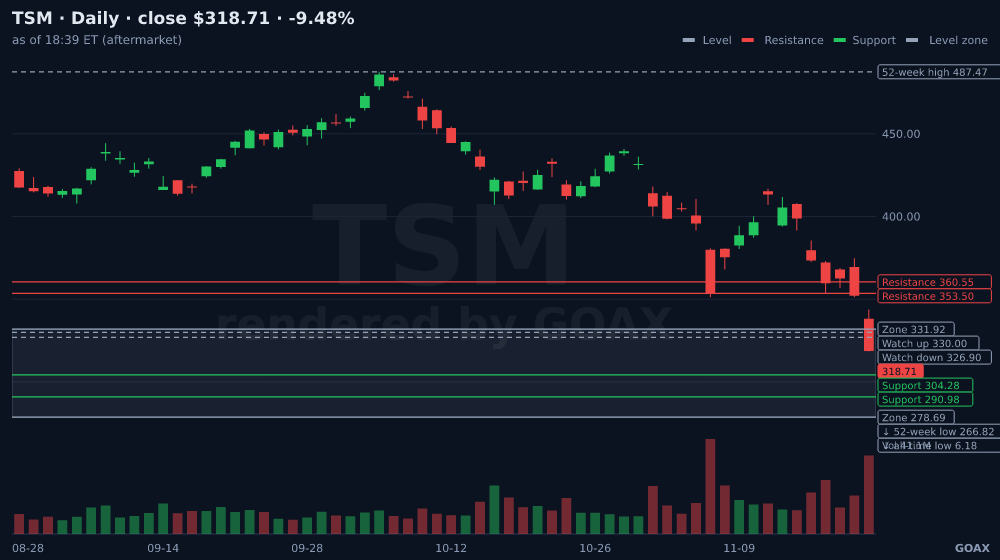
Where price sits: TSM broke down out of its range 351.19–380.78 and is now inside the wide range 278.69–331.92, in the bottom 25% of it. Direction is undecided in the middle of that range, so the practical levels decide it: up 330.00, down 326.90.
If it closes above 330.00, the next levels above are 353.50, 360.55 and 370.20 — all inside active zones, with 331.92, 337.92, 340.00, 342.15, 343.75, 349.40 and 351.19 stacked just overhead as places price may stall. Breakouts from here keep going about 4 in 10 times and fail about 5 in 10 within 10 days; the next daily candle is the tell — if it cannot make a new high, about 3 in 4 fail.
If it closes below 326.90, the levels below are 304.28, 290.98, then 266.82. Just under are 321.59, 320.00, 318.48, 311.70 and 310.00 as levels to watch. The fact that matters most is whether price holds or loses the range low at 278.69.
Two flags: dark pool flow today was urgent sell (70% of trades below mid), and put buying has escalated over the last three days. Daily pressure shows sellers while the 1-hour and 5-minute readings show buying, so the timeframes disagree. Options levels (max pain $400, put wall $360, call wall $450) are from last night's open interest, not live.
Bottom line: Monday hinges on 330.00 up / 326.90 down.
SEPT only provides tools. No trading advice or suggestions. Full disclaimer
What's behind the week: the news points to the new US export rules tightening AI chip exports to five countries and hitting chips at 16nm. Benzinga reported (Nov 20) that Taiwan's main index fell 6.2% Friday for a roughly 17.5% weekly decline — its worst week since 1990 — with TSMC down 4.8% in Taipei Friday and 15.8% on the week. A Trefis piece (Nov 20) notes this was TSM's worst week since March 2020. Note the earnings flag in the news feed is not the driver — TSMC already reported Q3 on Oct 15 (6-K), with October revenue up 59.7% year-over-year (6-K, Nov 10).
Where price sits: TSM broke down out of its range 351.19–380.78 and is now inside the wide range 278.69–331.92, in the bottom 25% of it. Direction is undecided in the middle of that range, so the practical levels decide it: up 330.00, down 326.90.
If it closes above 330.00, the next levels above are 353.50, 360.55 and 370.20 — all inside active zones, with 331.92, 337.92, 340.00, 342.15, 343.75, 349.40 and 351.19 stacked just overhead as places price may stall. Breakouts from here keep going about 4 in 10 times and fail about 5 in 10 within 10 days; the next daily candle is the tell — if it cannot make a new high, about 3 in 4 fail.
If it closes below 326.90, the levels below are 304.28, 290.98, then 266.82. Just under are 321.59, 320.00, 318.48, 311.70 and 310.00 as levels to watch. The fact that matters most is whether price holds or loses the range low at 278.69.
Two flags: dark pool flow today was urgent sell (70% of trades below mid), and put buying has escalated over the last three days. Daily pressure shows sellers while the 1-hour and 5-minute readings show buying, so the timeframes disagree. Options levels (max pain $400, put wall $360, call wall $450) are from last night's open interest, not live.
Bottom line: Monday hinges on 330.00 up / 326.90 down.
SEPT only provides tools. No trading advice or suggestions. Full disclaimer
Data GOAX checked✓ Price & zones✓ News✓ Reasoning✓ Analyze flow
Copied exactly as GOAX answered at 6:39 PM ET on Nov 20, 2026. Market data changes during the day.
TSM on SEPT
More real GOAX answers
- Please answer in English. BILL agreed yesterday to be bought by TPG and Corpay for $63.25 a share in cash, but $BILL closed today around $61.45, below the deal price. Why is BILL trading below the buyout price, what did the filing say about the deal terms and timing, and how is it trading after hours? · Nov 20, 2026
- Please answer in English. The whole market got crushed today, but $GAP closed up about 11%. Why did Gap rally on a day like this after cutting its full-year outlook, what did its earnings release say, and where are GAP's key levels into Monday? · Nov 20, 2026
- Please answer in English. The Nasdaq 100 ($QQQ) is down almost 5% this afternoon and the S&P 500 is now in a correction. Why is QQQ falling so hard today, is this about AI spending fears, and where are QQQ's key levels into the close? · Nov 20, 2026
Ask GOAX your own question
GOAX reads SEPT's real-time computed data: key levels, real buying vs. selling, flow and filings.
Try GOAX freeWeekly: key levels to watch + one trader question answered. Free.
We email a confirm link first. Unsubscribe any time. Tools and data, not investment advice.
Tools and data, not investment advice. Past results don't predict future results.